


0 引言
四川盆地页岩气资源量丰富,随着涪陵、长宁—威远、昭通等埋深3 500 m以浅的页岩气实现了规模效益开发[1-5],下一个规模上产主阵地为埋深3 500 m以深的页岩气[6-9]。威荣页岩气田位于川西南坳陷北部威远构造东南翼至自流井组构造之间的白马镇向斜,断层不发育,构造幅度小于300 m,气藏埋深3 550~3 880 m,为国内首个规模开发的深层页岩气田。由于没有成熟的深层页岩气开发经验可供参考,因此,在方案设计阶段借鉴了国内外尤其是国内中深层威远—长宁和涪陵2个国家级页岩气示范区的开发经验[10-11],设计采用400 m开发井距,但在一期产建实施过程中,通过微地震监测等手段,揭示400 m井距井间剩余大量未动用区,为提高储量动用程度,采用地质—工程一体化方法将二期产建区的井距优化至300 m。
由于初期认为气田天然裂缝不发育且考虑同平台同步投产模式,未制定差异化井距设计方案,但随着产建的推进,逐步认识到气田小微尺度裂缝发育,在裂缝发育区以及老井采空区压窜频发,严重影响了产建效果,亟需针对性进行井距优化设计。目前,井距设计主要采用微地震监测[12-14]、大数据分析[15-16]、动态分析[17-18]和数值模拟[19-25]等方法,微地震监测事件点仅反映压裂过程中应力变化分布,不代表有效改造区范围;大数据分析使用条件较为苛刻,需要满足气藏地质条件和改造工艺相似才能适用,否则计算结果误差较大;动态分析、数值模拟是主流的井距设计方法,这2种方法对建立模型可靠性(缝长、缝高等特征参数)的依赖程度较强,但由于模型参数的多解性,要建立可靠模型难度往往较大。为此,笔者通过以真实邻井压降数据校正数值模拟模型为基础,定量评价井间干扰对EUR的影响,针对性地优化设计井距,并通过实例应用验证了优化设计结果的可靠性,提升了气田的产建效果。
1 井间干扰现状
威荣气田在压裂和生产过程中压窜频发,压窜井比例高达44%,且部分井发生多次压窜,随投产井数和投产时间的增加,年度投产井平均开井压力(排液稳定生产后)整体呈现逐步降低趋势,从产能建设初期的50 MPa降至2023年度的39 MPa左右,严重影响了产能建设效果。气田窜通干扰主要有2种形式:
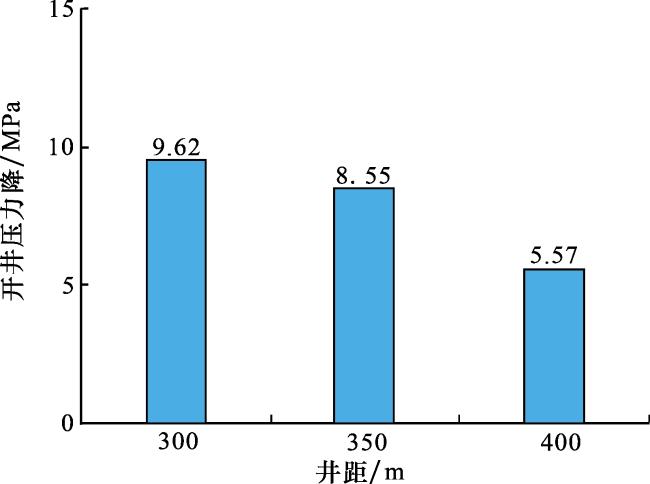
(1)裂缝发育区窜通干扰。压裂液沿天然裂缝高渗带突进,引发窜通,最远影响距离为1.7 km,该方式影响开井压力在0.3~14.2 MPa之间,平均为4.6 MPa。表现出2个特点:①裂缝越发育,影响越大。裂缝发育区平均影响为5.52 MPa,而欠发育区平均影响为1.92 MPa。②在相当裂缝密度下,井距越小,影响越大。300 m井距下平均影响为7.29 MPa,400 m井距下平均影响为2.95 MPa。
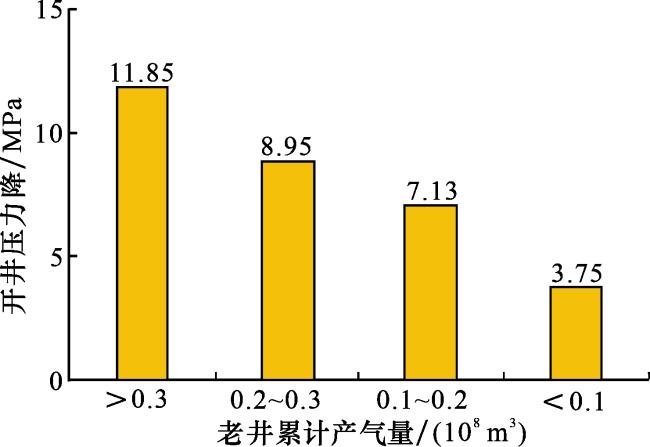
部分窜通井既位于裂缝发育区又处于老井附近,通过对气田裂缝密度进行归类评价,并结合示踪剂窜通程度的监测结果,建立了裂缝发育程度分类标准。将裂缝密度<6条/m、老井累产气量≥0.15×108 m3的窜通井划分为主要受老井能量亏空干扰影响的窜通井;而将裂缝密度≥6条/m、老井累产气量<0.15×108 m3的窜通井划分为主要受裂缝窜通干扰影响的窜通井。
2 干扰对产能影响
数值模拟是定量评价干扰对气井产能影响的有效方法,在分析干扰对产能的影响前,必须首先确定井间干扰程度(针对裂缝发育区井间窜通),然后,需要根据邻井压力校正数值模拟模型,最后才能够根据校正好的数值模拟模型分析干扰对EUR的影响。
2.1 井间干扰程度分析
威荣气田开发井距主要有400 m和300 m共2种。根据井间示踪剂监测结果,在400 m井距下,气井与相邻井的窜通(干扰)程度在8%~38%之间,平均为27%,而300 m井距下,气井与相邻井的窜通程度在35%~65%之间,平均为53%。因此,在评价裂缝发育区井间干扰对气井EUR的影响时,对于300 m井距设置窜通程度为50%,而对于400 m井距设置窜通程度为30%。
2.2 数值模拟模型校正
人工压裂裂缝模型的精细程度直接决定了数值模拟研究的可靠程度。威荣气田人工压裂裂缝模型主要采用kinetix压裂模拟结合微地震监测结果综合确定,裂缝高度20~30 m、裂缝长度150~270 m,数值模拟预测最大动用范围为292 m,小于实施井距,此时,压力干扰不会波及至邻井,邻井开井生产不会有压降,但通过对气田投产100余口的统计分析,邻井平均压降达到5.7 MPa,与数值模拟结果不符,表明建立的数值模拟模型是不可靠的,为支撑井距的优化,必须对数值模拟模型进行校正,邻井的压力变化反映了气井的井控范围,而气井的井控范围决定了井距设计,为此,通过统计不同井距、不同累产气下邻井开井时地层压力,建立标准化压降漏斗图版,以此校正数值模拟模型。
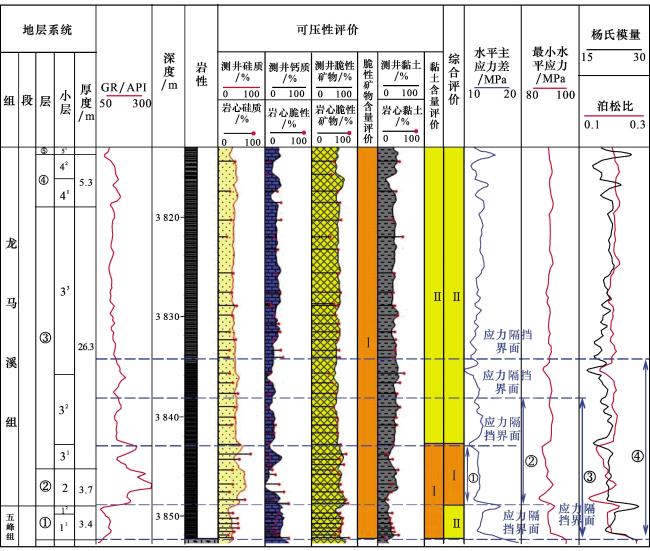
数值模拟结果失真的主要原因是对缝高模型认识存在偏差,为此,调研了国内涪陵气田、中国石油威远气田支撑缝高模型[32-33],并结合气田导眼井纵向应力剖面(图3),划分了5个应力隔挡层,建立了4种缝高模型。模型①:考虑应力影响,裂缝不能突破2小层和31小层,缝网主要分布在2~31层,厚度7 m;模型②:不能突破2小层和32中部,厚度10 m;模型③:不能突破1小层和32中部,厚度15 m;模型④:不能突破1小层和33中部,厚度20 m。在缝高模型确定的基础上,通过压裂模拟和动态反演方法综合确定缝长,建立4种数值模拟模型。通过数值模拟计算不同模型的压降漏斗(图4),再与不同累产气、不同井距的实际压降数据进行对比,进而对数值模拟模型进行校正。
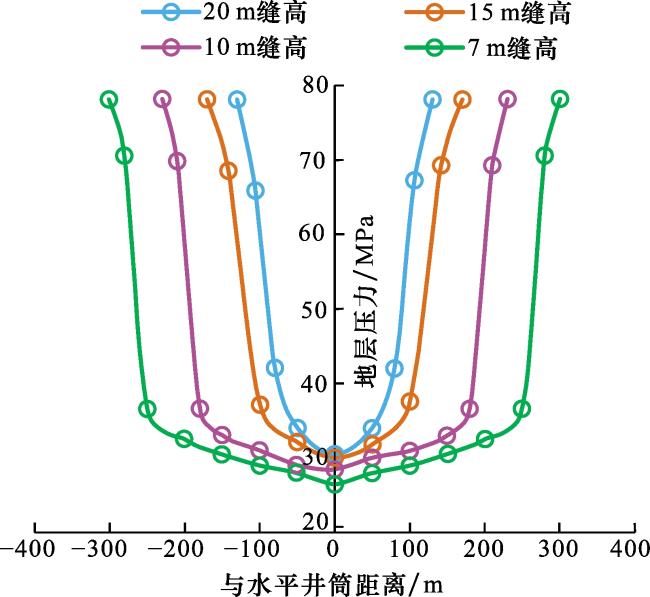
威荣气田气井以300 m井距为主,单井累计产气量主要在(0.2~0.38)×108 m3之间,因此,选取井距300 m、单井平均累计产气量为0.3×10⁸ m3的气井开展数值模拟模型的校正。据统计,气井在井距300 m、累计产气量为0.3×10⁸ m3时,新井实测静压或计算地层压力在63.2~72.6 MPa之间,平均为67.7 MPa。4种缝高数值模拟模型计算300 m处地层压力分别为33.5 MPa、51.4 MPa、68.5 MPa和78 MPa,实际值(实测值)与15 m缝高模型计算结果比较吻合。同时,结合中国石油威远—长宁气田缝高确定的经验,综合确定威荣气田采用15 m缝高数值模拟模型。
2.3 干扰对EUR影响
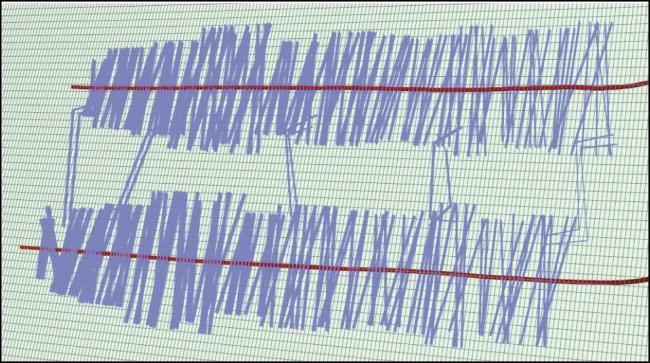
表1 数值模拟模型基础参数Table 1 Basic parameter table of numerical simulation model |
| 参数 | 值 | 参数 | 值 | ||
|---|---|---|---|---|---|
| 初始气藏压力/MPa | 78 | 人工裂缝开度/m | 0.005 | ||
| 气藏温度/℃ | 132 | 页岩质量密度/(t/m3) | 2.5 | ||
| 页岩孔隙度/% | 5 | 兰氏体积/(m3/t) | 2.07 | ||
| 原始含水饱和度/% | 35 | 兰氏压力/MPa | 7.3 | ||
| 渗透率 /(10-3 μm2) | 含支撑剂主缝 | 1 800 | 人工裂缝应力敏感系数/MPa-1 | 0.06 | |
| 含支撑剂分支缝 | 0.025 | 水平段长度/m | 1 500 | ||
| 不含支撑剂分支缝 | 0.003 8 | 压裂段数 | 20 | ||
| 基质 | 1.0×10⁻⁵ | 窜流系数 | 裂缝发育区 | 3.1×10⁻⁶ | |
| 人工裂缝半长/m | 85~171 | 裂缝欠发育区 | 7.6×10⁻⁷ | ||
2.3.1 裂缝窜通干扰影响
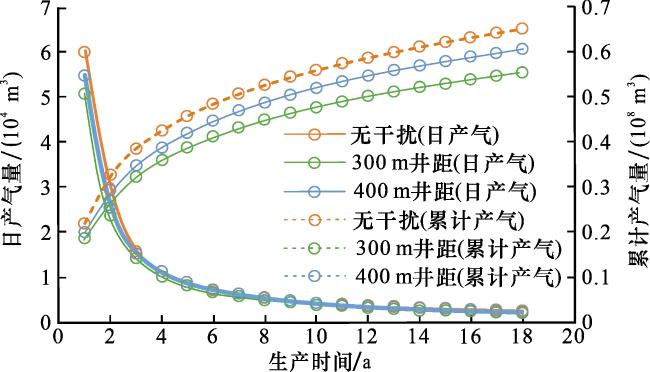
分别建立300 m和400 m井距、窜通率30%和50%的井组数值模拟模型,研究在不同井距和窜通程度情况下,井间干扰对新井EUR的影响。从图6可以看出,随井距减小,窜通程度的增加,对气井产能的影响逐步加剧。在400 m井距、窜通程度30%时,首年日产气量为无干扰井的91.2%,EUR降低了458×104 m3,降幅为7.1%;当井距减小至300 m、窜通程度增加至50%时,首年日产气量为无干扰井的84.7%,EUR降低了986×104 m3,降幅为15.1%。
2.3.2 老井能量亏空干扰影响
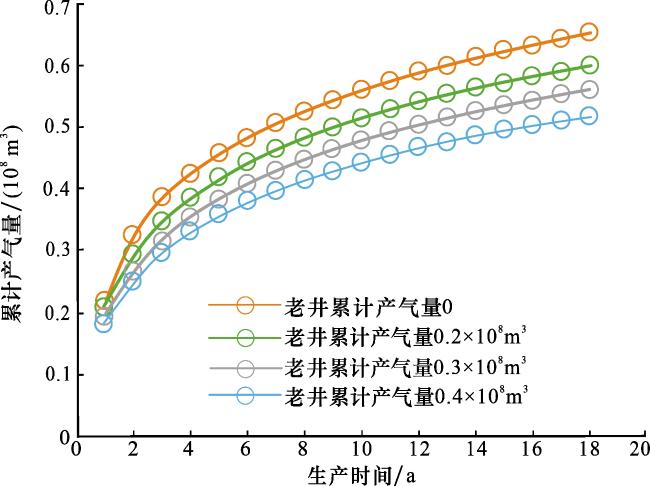
威荣气田气井投产时间较短,平均单井生产时间仅为2.4 a,单井累计产气量主要分布在(0.2~0.4)×108 m3之间,平均为0.28×10⁸ m3。因此,建立老井累计产气量分别为0.2×10⁸ m3、0.3×10⁸ m3和0.4×10⁸ m3,新老井间距为300 m和400 m的数值模拟模型,研究在不同老井累产气和井距情况下,井间储量动用干扰对新井EUR的影响。从图7,图8可以看出,井距越小、老井累产气量越高,对新井的影响也更严重。在井距300 m下,老井累计产气量分别为0.2×10⁸ m3、0.3×10⁸ m3和0.4×10⁸ m3时,预测新井EUR分别降低807×104 m3、1 317×104 m3和1 842×104 m3,降幅分别为12.4%、20.2%和28.2%;而在井距400 m老井相应累计产气量下,预测新井EUR分别降低536×104 m3、926×104 m3和1 341×104 m3,降幅分别为8.1%、14.2%和20.6%。在相当老井累产气量下,400 m井距相较于300 m井距,新井EUR的降幅低4.2~7.7个百分点。
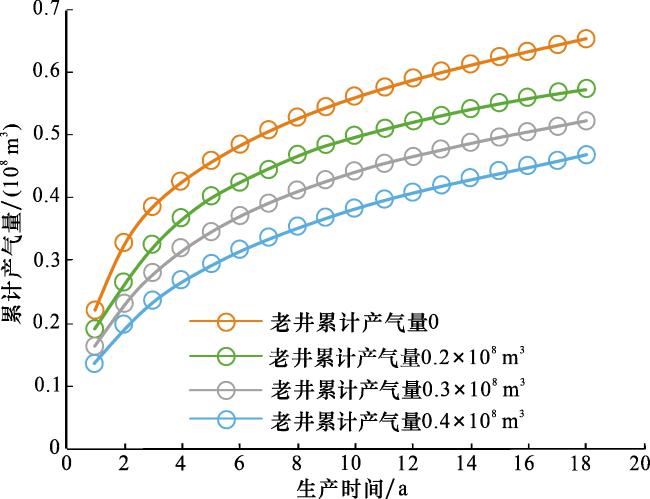
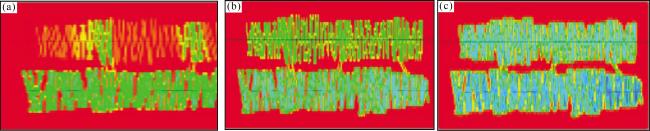
图7 300 m井距不同老井累计产气量下新井产量曲线Fig.7 Production curve of new wells under different cumu-lative gas production in old wells with a 300 m well spacing |
3 井距优化研究
在定量评价干扰对新井EUR影响的基础上,采用数值模拟方法,以实现储量动用最大和产出投入比最高为原则,开展了裂缝发育区和老井亏空区井距的优化设计。
3.1 裂缝发育区
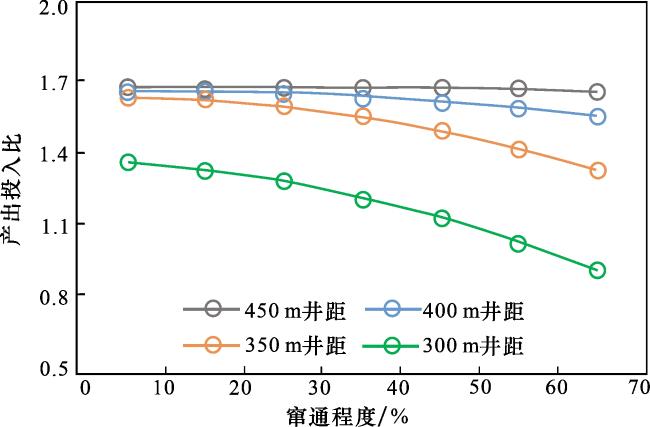
分别建立不同井距(300 m、350 m和400 m)和不同窜通程度(5%、15%、25%、35%、45%、55%、65%)的数值模拟模型(图9),研究不同井距以及窜通程度下产出投入比的变化,以此优化裂缝发育区井距。从图10可以看出,在裂缝发育区,300 m井距下产出投入比只有350 m和400 m井距的75%左右,表明受井间干扰,单井EUR出现了明显的降低,且随着窜通程度的增加,井间干扰对EUR的影响逐渐加剧,因此,方案设计的300 m井距(方案设计阶段预测天然裂缝整体不发育)是不合适的,需要对裂缝发育区的井距进行优化调整;而对于350 m、400 m和450 m井距模型,在窜通程度分别>25%、>50%和>65%后,产出投入比均出现了降幅逐渐加剧的趋势,此时就需要对井距进行调整。通过数值模拟研究,建议在裂缝发育区,对于窜通程度≤25%的井区,井距调整至350 m;对于25%<窜通程度≤55%的井区,井距调整至400 m;对于55%<窜通程度≤65%(示踪剂监测最大窜通程度)的井区,井距调整至450 m。
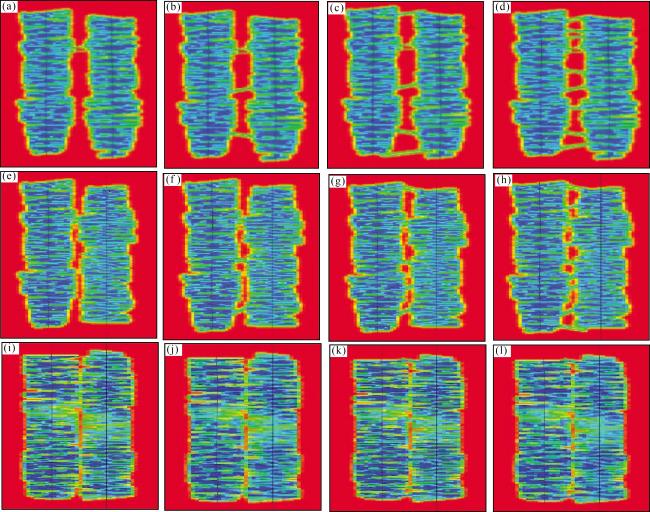
图9 不同井距和不同窜通程度模型评价期末预测地层压力分布(a)400 m井距窜通5%;(b)400 m井距窜通15%;(c)400 m井距窜通35%;(d)400 m井距窜通65%;(e)350 m井距窜通5%;(f)350 m井距窜通15%; (g)350 m井距窜通35%;(h)350 m井距窜通65%;(i)300 m井距窜通5%;(j)300 m井距窜通15%;(k)300 m井距窜通35%;(l)300 m井距窜通65% Fig.9 Formation pressure distribution forecast using models with different well spacing and different degrees of breakthrough |
3.2 老井亏空区
采用重启数值模拟方法,分别在老井累计产气量为0.2×10⁸ m3、0.3×10⁸ m3和0.4×10⁸ m3时(图11),建立与老井井距在300~500 m之间的新井数模模型(图12),研究不同井距以及老井累产气量对新井EUR的影响,以此优化老井亏空区井距。从图12可以看出:①在老井累计产气量0.2×10⁸ m3、井距≥400 m时,老井对新井EUR的影响较小,当井距<400 m后,新老井间干扰显著变强,EUR降幅由400 m井距的3.1%增加至300 m井距的10.3%;②在老井累计产气量0.3×10⁸ m3时,当井距<450 m后,新老井间干扰显著变强,EUR降幅由450 m井距的6.1%增加至300 m井距的11.4%;③在老井累计产气量0.4×10⁸ m3、井距500 m时,新井EUR基本不受老井生产影响,但随着井距减少,新井EUR快速降低。因此,建议在老井累计产气量为0.2×10⁸ m3时,新老井井距在400 m左右;在老井累计产气量为0.3×10⁸ m3时,新老井井距在450 m左右;而在老井累计产气量为0.4×10⁸ m3时,新老井井距不低于500 m。
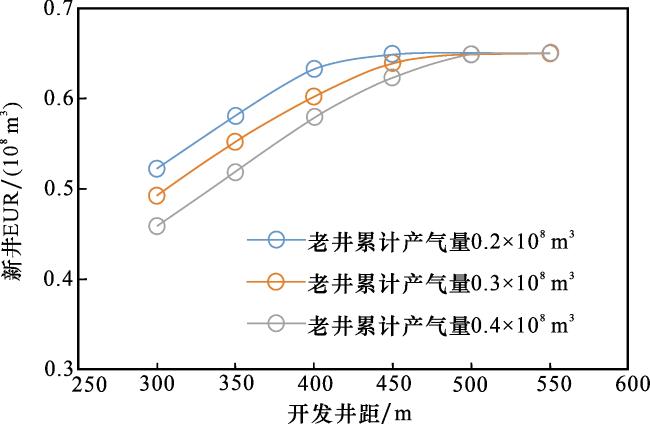
图11 不同井距和老井累计产气量下新井EUR变化曲线Fig.11 EUR variation curve of new wells under different well spacing and cumulative production of old wells |
4 实例应用
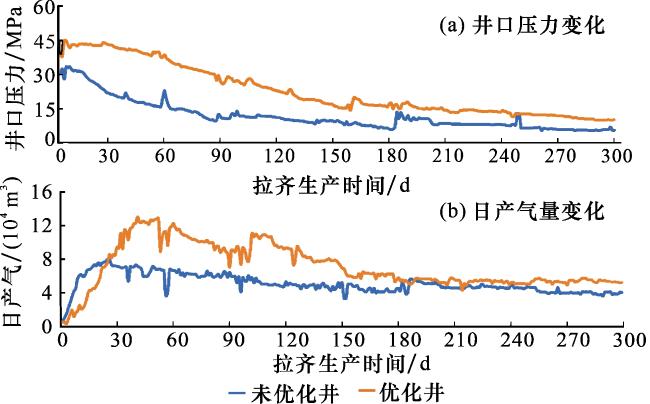
在井距优化设计的基础上,针对威荣气田二期产建区的局部裂缝发育区开展了井网部署优化,以某3个平台为例,优化前总体部署30口井,井距300 m,优化后部署25口井,井距在300~450 m之间(图13)。从压裂期间的压窜统计来看,在裂缝密度和压裂规模相当的情况下,井距优化后压窜率降低了22.7个百分点、压窜对产量的影响降低了83%。从优化前后均一化生产对比曲线来看(图14),在压裂工艺和参数相当的情况下,井距优化后,由于井间窜扰较少,气井开井压力较未优化井提高了9.3 MPa,峰值产气量提高了5.3×10⁴ m3/d,前300 d单位井口压降产气量由55.5×10⁴ m3/MPa提高至61.3×104 m3/MPa,增幅为10.7%,预测EUR由0.57×108 m3提高至0.7×10⁸ m3,增幅为22.8%,取得了较好的应用效果。
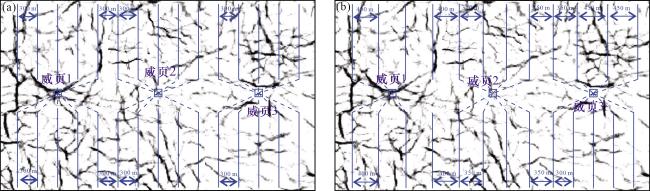
图13 威荣气田某典型平台井距优化前后井位部署(a) 优化前;(b) 优化后 Fig.13 Well pattern arrangement before and after optimizing the well spacing of a typical platform in Weirong Gas Field |
5 结论
(1)四川盆地威荣气田压窜频发,平均压窜比例为44%,受井间干扰影响,年度井开井压力由产建初期的50 MPa降低至39 MPa左右,严重影响了产建效果。井间干扰主要有裂缝发育区窜通干扰和老井能量亏空干扰2种形式,分别平均影响气井开井压力4.6 MPa和8.5 MPa。
(2)前期数值模拟模型计算邻井压降与实际压降数据存在较大偏差,原因为对缝高模型认识存在偏差。为此,根据导眼井纵向应力剖面(考虑应力隔挡的影响),建立了7 m、10 m、15 m和20 m 4种缝高模型,通过4种模型计算出的地层压力与实际地层压力对比,认识到15 m缝高模型是与实际相符的模型。
(3)数值模拟揭示,井距越小、窜通程度越高,裂缝窜通干扰对气井产能的影响越大,考虑井距在300~400 m之间、窜通程度在30%~50%之间,对新井EUR的影响程度在7.1%~15.1%之间。井距越小、老井累计产气量越高,老井亏空干扰对新井EUR影响越大,考虑井距在300~400 m之间、老井累计产气量在(0.2~0.4)×108 m3之间,对新井EUR的影响程度在8.1%~28.3%之间。
(4)采用数值模拟方法,分别对裂缝发育区和老井亏空区井距进行了优化设计。研究表明,在天然裂缝发育区,根据窜通程度情况,优化井距在350~450 m之间;在老井附近,根据老井能量亏空情况,优化井距在400~500 m之间。
(5)井距优化实例应用表明,裂缝发育区井距由300 m优化至350~450 m之间后,气井开井压力提高了9.3 MPa,单位井口压降产气量提高了10.7%,预测EUR提高了22.8%,取得了较好的应用效果。
 甘公网安备 62010202000678号