0 引言
1 研究区地质概况
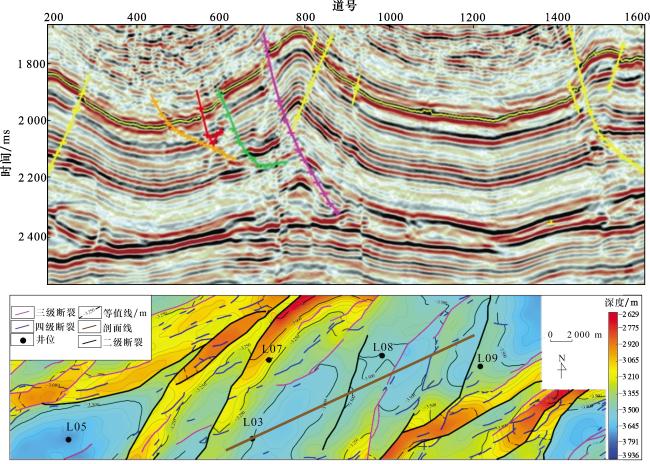
图2 泸州北区垂直构造剖面(a)及五峰组底界构造图(b)Fig.2 Vertical structural profile (a) and structural map (b) of the bottom boundary of Wufeng Formation in North Luzhou region表1 泸州北区五峰组—龙一1亚段实验室测量的地应力参数统计结果 |
Table 1 Statistical results of in-situ stress parameters measured by laboratory in Wufeng Formation-Long 11 submember,North Luzhou region |
| 井号 | 垂向主应力/MPa | 最大水平主应力/MPa | 最小水平主应力/MPa | 水平应力差/MPa | 水平应力差异比 |
|---|---|---|---|---|---|
| L03 | 101.30 | 109.60 | 93.60 | 16.00 | 0.15 |
| L05 | 101.12 | 103.58 | 90.65 | 12.93 | 0.12 |
| L07 | 89.80 | 94.50 | 83.60 | 10.90 | 0.12 |
| L08 | 97.96 | 104.82 | 92.21 | 12.71 | 0.20 |
| L09 | 93.86 | 100.53 | 84.40 | 16.13 | 0.16 |
2 泸州北区地应力地震预测方法
2.1 叠前道集优化处理
2.1.1 AVO剔除拟合能量补偿
2.1.2 SVD方法去除随机噪音
2.2 叠前各向异性反演理论
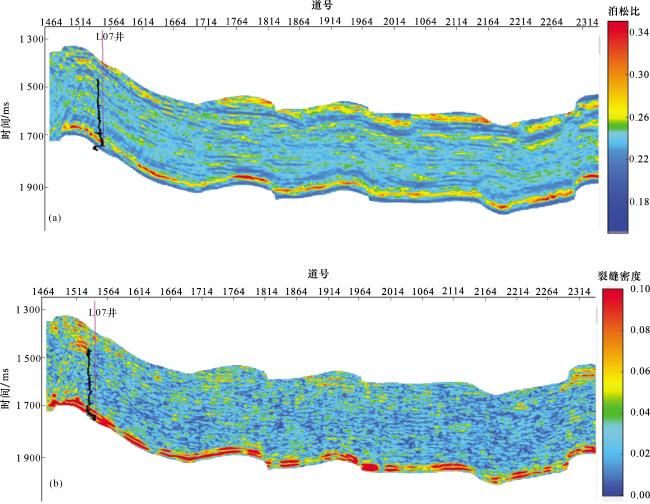
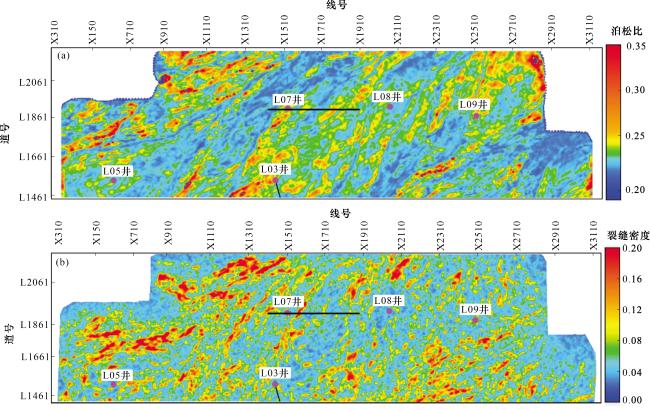
图5 泸州北区过L07井五峰组—龙一1亚段叠前各向异性反演剖面(a) 过L07井五峰组—龙一1亚段泊松比反演剖面;(b) 过L07井五峰组—龙一1亚段裂缝密度反演剖面 Fig.5 Inversion profile of prestack anisotropy of Wufeng Formation-Long11 submember in Well L07,North Luzhou region |
2.3 水平应力差异比估算
3 预测效果分析
3.1 叠前资料优化处理效果分析
3.2 叠前各向异性反演效果分析
3.3 地应力预测效果分析
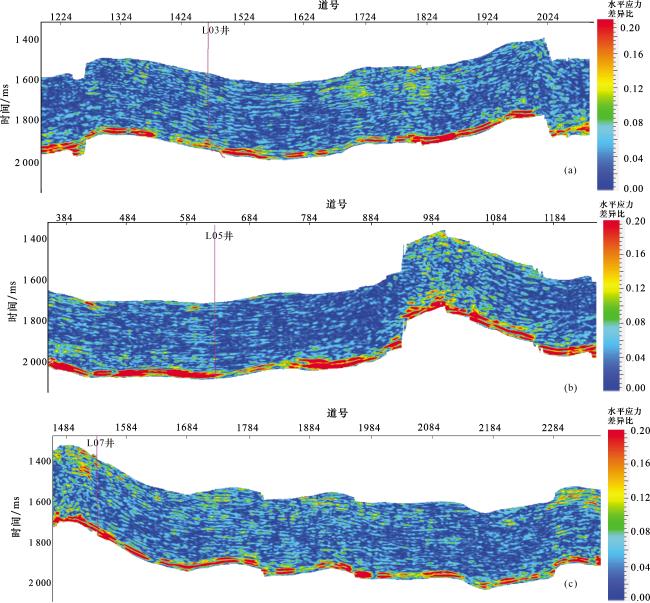
表2 泸州北区五峰组—龙一1亚段DHSR误差统计Table 2 DHSR prediction result of the Wufeng Formation-Long11 submember in North Luzhou region |
| 井号 | L03 | L05 | L07 | L08 | L09 |
|---|---|---|---|---|---|
| 室内测量 | 0.146 5 | 0.118 5 | 0.115 3 | 0.112 1 | 0.133 3 |
| 地震预测 | 0.155 0 | 0.121 2 | 0.111 1 | 0.121 7 | 0.129 7 |
| 绝对误差 | 0.008 5 | 0.002 7 | 0.004 2 | 0.009 5 | 0.003 7 |
| 相对误差/% | 5.79 | 2.30 | 3.67 | 8.48 | 2.75 |
图11 泸州北区五峰组—龙一1亚段有利区划分结果Fig.11 Favored zone results of Wufeng formation-Long11 submember in North Luzhou region |
表3 泸州北区部分井水平段长、测试产量、首年平均日产及EUR统计Table 3 Horizontal section length, test production, first year average daily production and EUR of some wells in north Luzhou region |
| 井号 | 水平段长/m | 测试产量 /(104 m3/d) | 首年平均日产 /(104 m3/d) | EUR /(108 m3) |
|---|---|---|---|---|
| L05 | 1 825 | 20 | 5.48 | 1.00 |
| L07 | 1 500 | 31 | 10.99 | 1.25 |
| L08 | 1 532 | 27 | 13.35 | 1.16 |




 甘公网安备 62010202000678号