


0 引言
超压成因分析一直是石油地质学研究的重要内容。超压成因研究经历了3个阶段[1]:①20世纪90年代中期(1994年)以前:不均衡压实主张占主导的阶段;②20世纪90年代中后期(1994—2000年):不均衡压实与生烃膨胀认识为主的阶段;③21世纪初以来:非欠压实成因受到广泛重视的阶段。超压成因分类亦取得了重要进展,如TINGAY [2]将超压成因机制分为不均衡压实机制和流体膨胀机制2种类型;OSBORNE等[3]将超压成因机制划分为3种类型:压应力增加、孔隙流体或岩石基质体积变化、流体流动或浮力。赵靖舟等[1]将超压按照成因分为5种成因类型,并总结提出6种分析方法,这些方法和观点在多个盆地得到了愈来愈多的证实和运用。
本文以准噶尔盆地莫索湾凸起为研究对象,综合现有的勘探成果和前人的研究认识,在对实测地层压力、泥浆密度和测井资料细致分析的基础上,应用测井曲线组合分析法、Bowers法、声波速度—密度交会图法、孔隙度对比法和超压成因综合分析法等对准噶尔盆地腹部莫索湾凸起侏罗系超压成因进行系统探讨,明确莫索湾凸起侏罗系异常高压成因机制。
1 地质背景
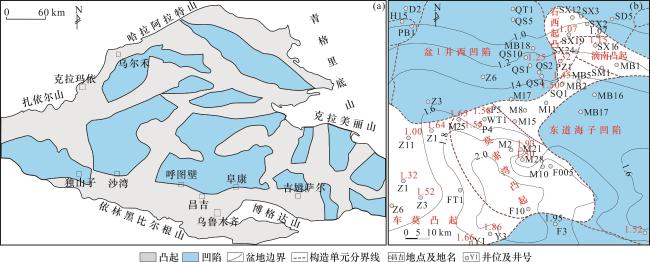
莫索湾凸起是在石炭纪基底基础上发育起来的位于准噶尔盆地中央凹陷的二级构造单元,东邻东道海子凹陷,西连盆1井西凹陷,南临莫南凸起,属于典型的“凹中凸”构造单元[图1(a)]。侏罗系沉积于陆内坳陷时期,自下而上为下侏罗统八道湾组(J1 b)、三工河组(J1 s),中侏罗统西山窑组(J2 x)、头屯河组(J2 t),上侏罗统齐古组(J3 q)、喀拉扎组(J3 k)。莫索湾凸起侏罗系超压主要发育在4 000~4 500 m以深地层,因此,本文主要研究层位以三工河组和八道湾组为主。三工河组岩性主要以砂岩、泥岩为主,距离下侏罗统八道湾组和二叠系烃源岩相对较近,油气成藏条件有利,是准噶尔盆地腹部地区主要的生产层系[21]。八道湾组岩性主要以砂岩、泥岩及煤层为主,是准噶尔盆地侏罗系主要的含煤地层。
2 超压分布特征
2.1 超压纵向分布特征
研究区探井随钻地层压力、泥浆密度及实测压力数据对侏罗系现今压力特征进行分析表明,莫索湾凸起侏罗系普遍存在超压。纵向上,研究区超压顶界面分布在J1 s,其对应深度在4 000~4 500 m之间,压力系数为0.92~2.11,普遍出现超压的层系为J1 s和J1 b。莫索湾凸起J1 s地层压力可达68.67~87.3 MPa,压力系数为1.31~1.95;J1 b地层压力可达72.252~105.98 MPa,压力系数为1.5~2.11[图2(a)]。
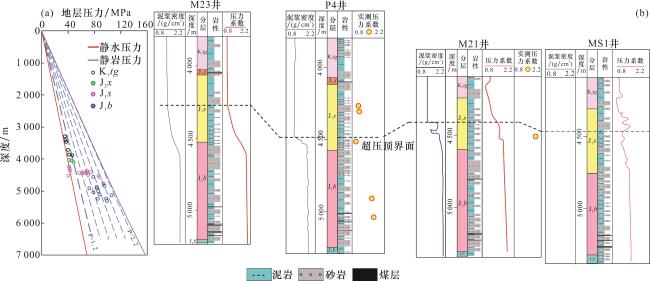
研究区西部—东部超压顶界面对应埋深有所变浅[图2(b)]。西部M23井和P4井超压顶界面都分布在J1 s,其超压顶界面对应深度分别为4 278 m和4 487 m。东部MS1井和M21井超压顶界面都分布在J1 s,其超压顶界面对应深度分别为4 467 m和4 417 m。研究区西部J2 x是由正常压力向超压过渡的压力转换带;东部K1 tg是压力转换带,J1 s以下地层普遍存在超压。
2.2 超压平面分布特征
平面上,研究区东部地层压力可达105.98 MPa,压力系数可达2.11;西部地层压力可达78.50 MPa,压力系数可达1.59。研究区超压具有东强西弱的特征,且主要分布在西南部,从莫索湾凸起中部向外超压减弱[图1(b)]。
3 超压成因机制
3.1 测井曲线组合分析方法
由于泥岩层段能收集到的实测压力数据有限,因此,在研究超压时可以利用测井资料间接地分析泥岩层段流体压力的特征。反映泥岩传导属性(声波时差和电阻率)和体积属性(密度和中子)的测井资料可以用来揭示超压的测井响应和判识超压成因。通过读取井径测井较平稳的纯泥岩层段的声波时差、电阻率及密度测井曲线综合分析超压响应特征和成因机制。
准噶尔盆地莫索湾凸起声波时差测井曲线、密度测井曲线、电阻率测井曲线对超压的响应较为明显,均存在不同程度的反转,且不同区域位置反转幅度存在一定差异。莫索湾凸起东部MS1井声波时差测井曲线和密度测井曲线发生同步反转,密度测井曲线反转略微滞后。莫索湾凸起西部M23井声波时差、电阻率及密度测井曲线发生同步反转。超压顶界面以下,随着埋藏深度的增加,MS1井和M23井的声波速度和电阻率都减小,密度则略微减小(图3)。因此,可以认为准噶尔盆地莫索湾凸起普遍存在超压。
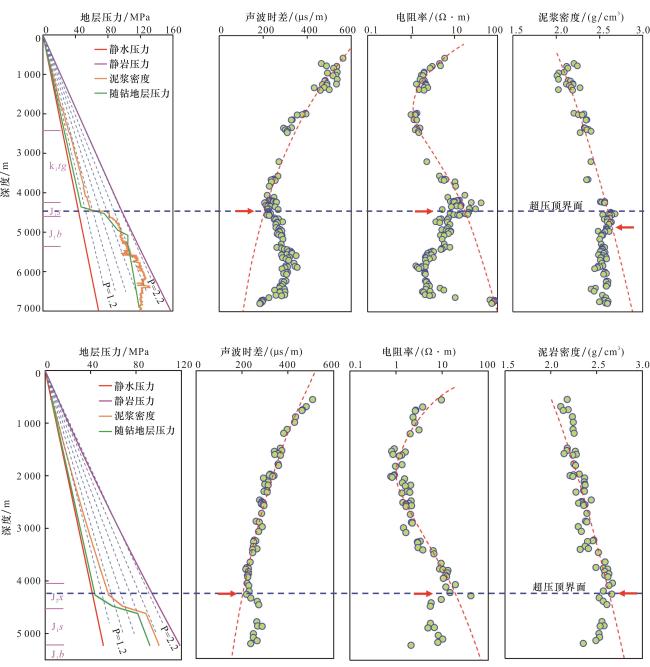
通过超压井的实测压力、钻井液密度等资料和泥岩层段的测井曲线特征综合分析发现,声波时差测井曲线和电阻率曲线在超压顶界面以深的地层明显地偏离了正常压实趋势,而密度测井曲线具有在超压顶界面以深的地层略有减小的特征。以MS1井和M23井为例,在埋深4 200~4 500 m以深的地层存在超压,声波时差和电阻率测井曲线在超压段明显偏离了正常压实趋势,声波速度和电阻率都减小,而密度则略微减小(图3)。因此,初步认为准噶尔盆地莫索湾凸起超压主要是非欠压实成因超压。
3.2 Bowers法
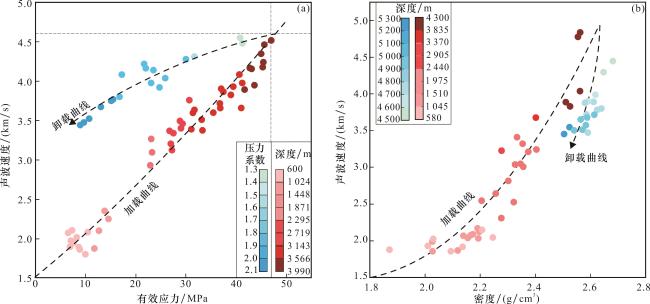
本文通过计算上覆地层压力和有效应力,应用Bowers加载模型和卸载模型分别计算其加载曲线和卸载曲线并绘制了研究区声波速度—有效应力交会图。在有效应力—声波速度交会图上,莫索湾凸起常压段数据都落在加载曲线上,超压段数据点均落在了卸载曲线上,且卸载曲线声波速度和有效应力都逐渐减小。压力系数在1.3~1.9范围内的数据点卸载速度减小较缓慢,而压力系数在1.9~2.1范围内的数据点卸载速度减小较快[图4(a)]。因此,认为研究区超压成因类型为传导型成因超压和黏土矿物转化引起的复合成因超压。
3.3 声波速度—密度交会图法
准噶尔盆地莫索湾凸起MS1井声波速度—密度交会图显示,超压段数据点都落在了加载曲线之外的流体膨胀/压力传导等非不均衡压实超压成因区域,随着深度增加其卸载速度逐渐加快,且越靠近加载曲线。因此,认为准噶尔盆地莫索湾凸起侏罗系超压成因类型为传导型成因超压和黏土矿物转化引起的复合型成因超压。
3.4 孔隙度对比法
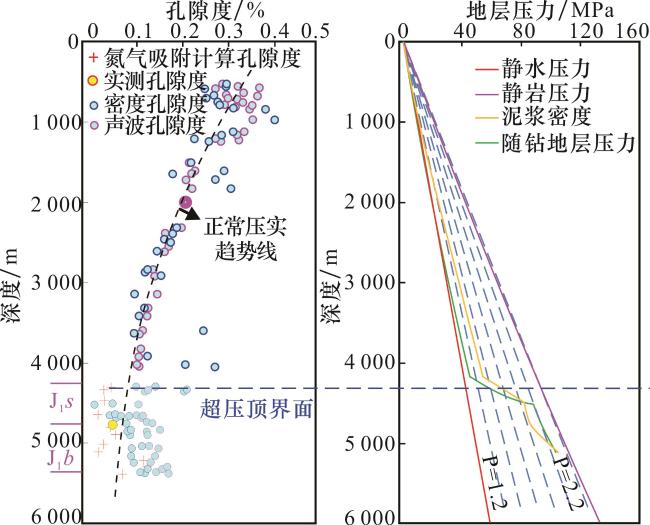
孔隙度符合正常压实趋势甚至出现异常低值则反映超压非欠压实成因,出现高孔隙度异常则反映超压欠压实成因[1]。
本文通过对比密度孔隙度和声波孔隙度发现,埋深4 200 m以深地层,密度孔隙度与声波孔隙度都沿着正常压实趋势线,在4 200 m以下深度,声波孔隙度和密度孔隙度略微偏离正常压实趋势线,且实测孔隙度基本落在了正常压实趋势线上,这与欠压实成因所表现出来的在顶界面开始发生大幅度反转大有不同[图5(a)]。因此,研究认为莫索湾凸起侏罗系欠压实成因贡献较弱或无。
3.5 超压成因综合分析
综合上述测井曲线组合分析法、Bowers法、声波速度—密度交会图及孔隙度对比法等4种方法判识结果,研究得出准噶尔盆地莫索湾凸起超压成因类型为传导型成因和化学压实复合型成因。
本文不仅运用了上述多种方法进行分析之外,还结合超压形成条件,地质环境等多种因素对超压成因进行了综合分析,最终确定了莫索湾凸起超压成因。
3.5.1 不均衡压实作用与超压关系
年轻沉积盆地的浅埋藏阶段(埋藏深度小于2 000~3 000 m)和厚层泥岩是不均衡压实发育的最佳环境[34]。准噶尔盆地莫索湾凸起J1 s及J1 b埋深较浅,泥岩厚度较薄,且J1 s,J1 b及其上覆沉积地层的沉积速率都较低。古近系平均沉积速率为24.80 m/Ma;白垩系平均沉积速率为28.72 m/Ma;J1 s平均沉积速率为9.33 m/Ma,最高沉积速率为15.58 m/Ma;埋藏深度为3 306~4 519 m。J1 b平均沉积速率为91.44 m/Ma,最高沉积速率为110.35 m/Ma;埋藏深度为3 710~5 059 m;三叠系平均沉积速率为19.20 m/Ma,最高沉积速率为22.11 m/Ma。
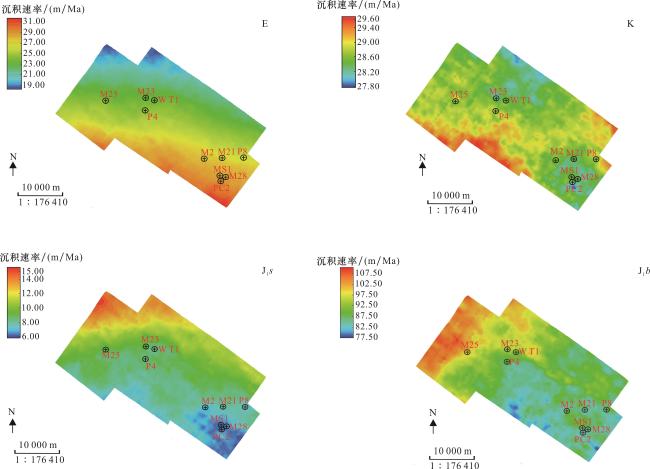
图6 莫索湾凸起超压发育层及上覆地层的沉积速率分布Fig.6 Sedimentary rate distribution of the overpressure development layer and overlying strata in the Mosuowan uplift |
表1 国内外典型沉积型超压盆地的沉积速率统计(据文献[37]修改)Table 1 Statistical table of sedimentation rates in typical sedimentary overpressure basins at home and abroad(modified from Ref.[37]) |
| 盆地 | 年代 | 层位/区域位置 | 沉积速率 /(m/Ma) | |
|---|---|---|---|---|
| 国内 | 莺歌海盆地 | 中新世 | 陵水组 | 450 |
| 三亚组 | 350~400 | |||
| 琼东南盆地 | 上新世 第四纪 | 陵水组 | 1 000 | |
| 三亚组 | ||||
| 中新世 | 梅山组 | 750 | ||
| 东海盆地丽水凹陷 | 古新世 | 灵峰组 | 400~500 | |
| 渤海盆地渤中凹陷 | 始新世 渐新世 | 沙河街组 | 100 | |
| 东营组 | 110~160 | |||
| 东海盆地西湖凹陷 | 始新世 | 平湖组 | 180~300 | |
| 国外 | 北苏门答腊盆地 | 中新世 | 巴翁组 | 305 |
| 马来盆地 | 中新世 | 贝科克组 | 306 | |
3.5.2 超压与二叠系烃源岩生烃及传导作用关系
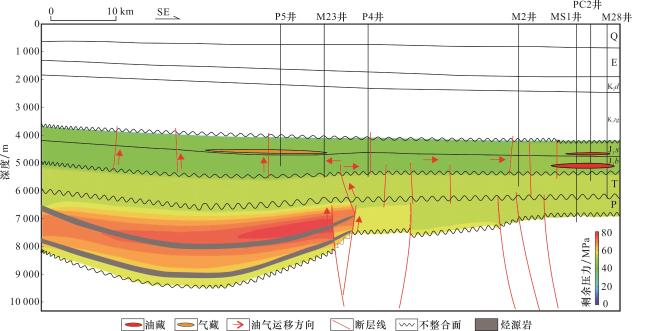
研究区主要存在侏罗系与二叠系2套烃源岩,其中二叠系烃源岩对目的层超压具有重要贡献,依据如下:①侏罗系为泥岩及煤系烃源岩,有机质丰度高,以Ⅱ2型和Ⅲ型有机质为主[38],属于“差”烃源岩[图7(a)]。热成熟度主要分布在0.4%~0.7%之间,属于未成熟—低成熟阶段,侏罗系烃源岩地层难以生成足量的烃类流体来形成生烃增压。侏罗系八道湾组烃源岩厚度与压力系数之间几乎没有明显的相关性[图7(b)],且侏罗系地层温度未能达到烃源岩大量生烃的要求,说明该套烃源岩对超压的贡献较弱或无。②前人大量的油气源对比研究表明莫索湾凸起油气主要来源于盆1井西凹陷。如姜林等[39]认为莫索湾凸起油气主要来源于盆1井西凹陷和昌吉凹陷中二叠统下乌尔禾组和下二叠统风城组烃源岩。廖健德等[40]则认为,莫索湾凸起有2种油气源,分别是盆1井西凹陷二叠系下乌尔禾组和风城组烃源岩。莫索湾凸起位于盆1井西凹陷和昌吉凹陷之间的隆起带,具有优越的烃源条件,白垩系和侏罗系的砂岩储集层发育,构造形成时间早于油气形成期。费李莹等[41]认为,莫索湾凸起侏罗系三工河组油气主要来源于盆1井西凹陷二叠系下乌尔禾组烃源岩。③详细的地层压力分布格局分析显示,自盆1井西凹陷向莫索湾凸起,超压(剩余压力)逐渐降低,且莫索湾凸起超压强度与盆1井西凹陷烃源岩成熟度、规模及生烃增压强度存在密切关系(图8)。
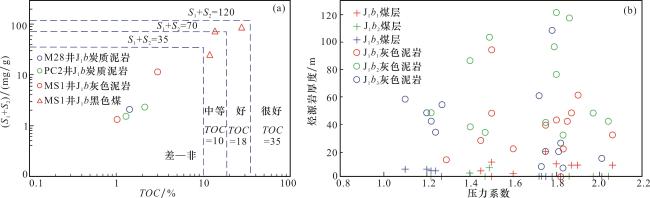
图7 莫索湾凸起侏罗系烃源岩质量评价图版(a)及烃源岩厚度与压力系数关系(b)Fig.7 Mosuowan uplift Jurassic hydrocarbon source rock quality evaluation map (a) and relationship diagram of hydrocarbon source rock thickness and pressure coefficient(b) |
3.5.3 化学压实超压贡献量计算
式中:σ和σn 分别为有效应力和常压条件有效应力,MPa;Δtn 为正常压实趋势声波时差,μs/m,取160 μs/m;Δt为实测声波时差,μs/m;n为模型指数,取3.2。
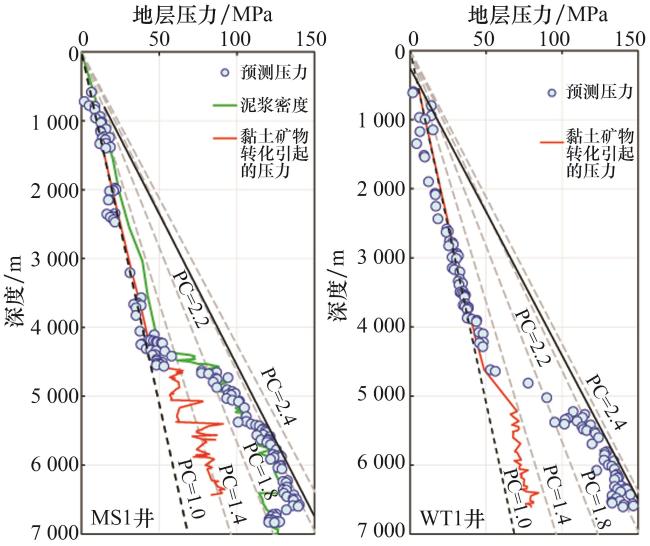
本文根据此模型对研究区化学压实成因引起的超压进行定量计算。结果显示,莫索湾东部化学压实成因引起的压力系数介于1.4~1.5之间、西部化学压实成因引起的压力系数介于1.3~1.4之间(图9)。由此得出,研究区东部化学压实成因超压贡献量高于西部。
4 结论
(1)准噶尔盆地莫索湾凸起侏罗系普遍发育超压,主要位于4 000~4 500 m以下埋深,压力系数为0.92~2.11;平面上东部超压较强,西部超压较弱。
(2)准噶尔盆地莫索湾凸起上不同井的声波时差测井曲线、密度测井曲线、电阻率测井曲线对超压的响应较为明显,表现为声波时差测井曲线和电阻率测井曲线均存在不同程度的反转,密度测井曲线反转幅度较小的特征。
(3)准噶尔盆地莫索湾凸起侏罗系地层超压以传导型成因超压与黏土矿物转化复合成因超压为主,且东部化学压实贡献略高于西部,欠压实成因贡献弱或者无。
 甘公网安备 62010202000678号