


0 引言
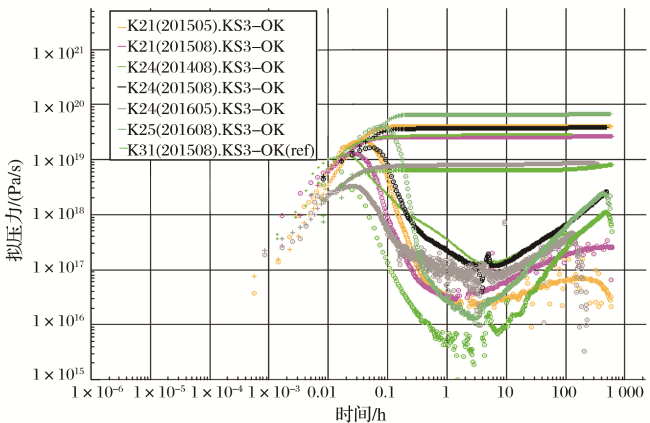
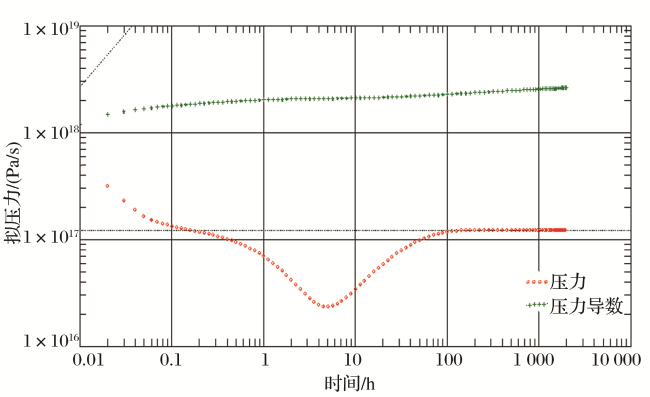
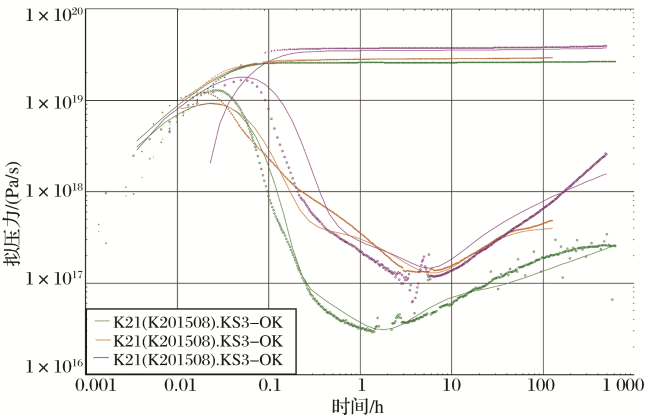
1 不稳定试井
2 渗流特征
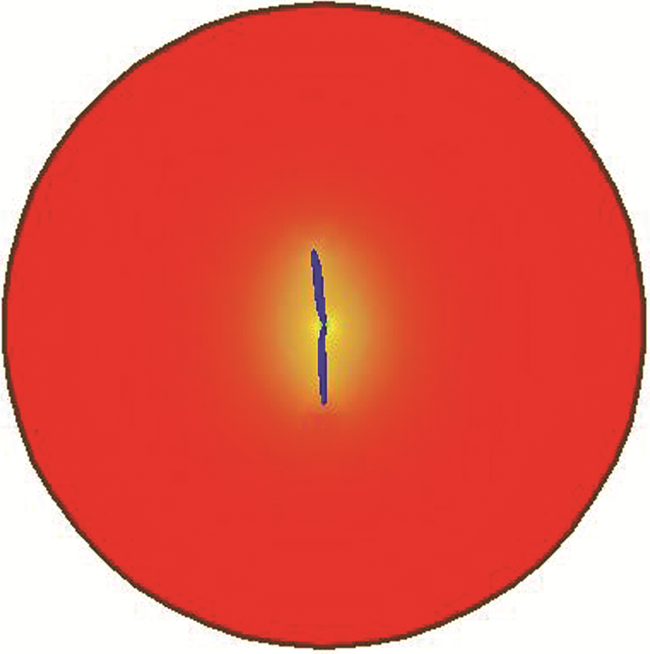
2.1 数值模型
2.2 压力传播特征
表1 压力传播特征数值模拟机理研究结果Table 1 Numerical simulation research results of reservoir pressure propagating property |
| 机理 模型 | 井间干扰试井 | ||
|---|---|---|---|
| 压力恢复曲线 | 压力传播速度/(m/s) | 压力传播特征 | |
| 双重介质 | 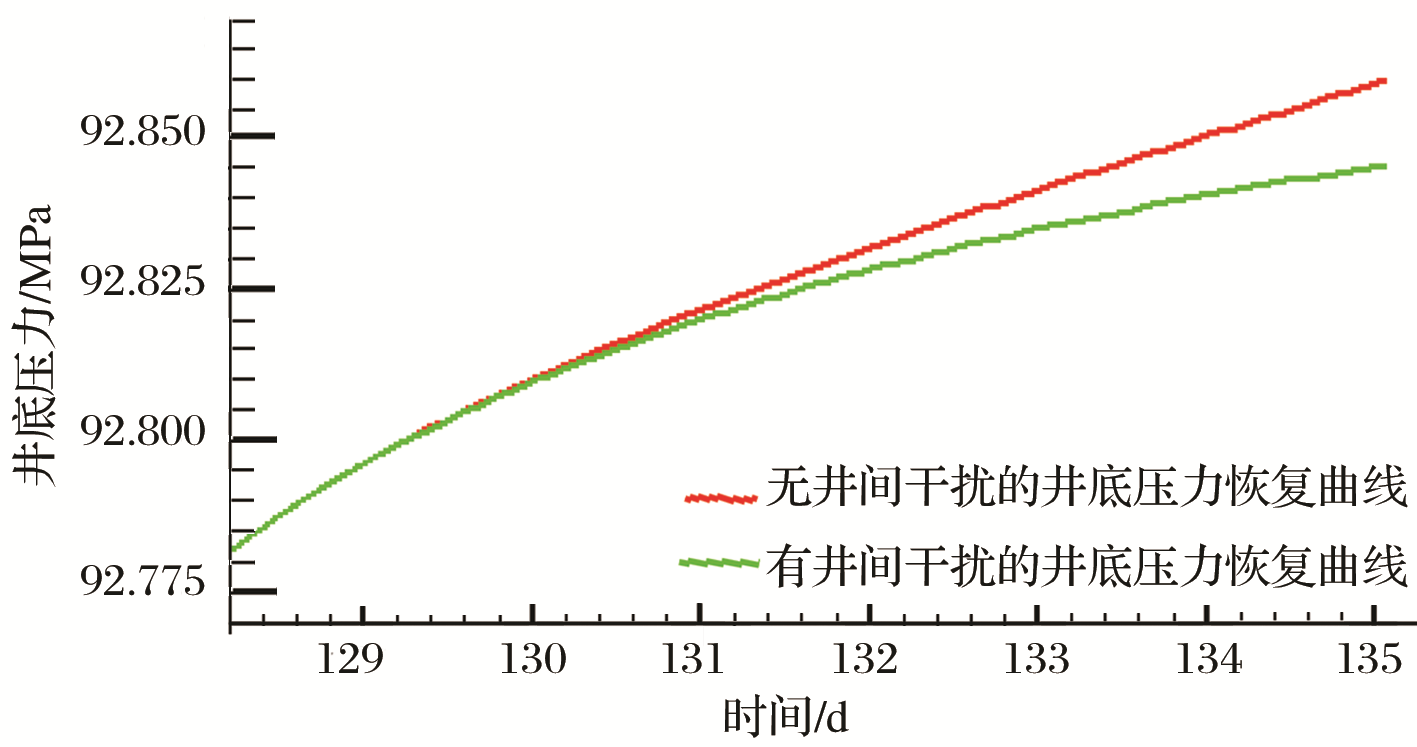 | 0.21 | 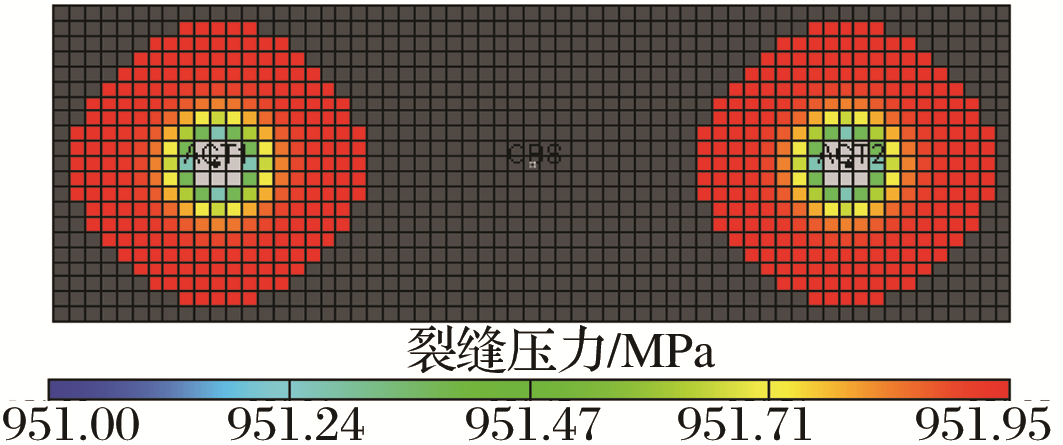 激动井压力沿径向均匀传播,速度极慢,干扰强度低,观测井压力呈不断恢复上升趋势 |
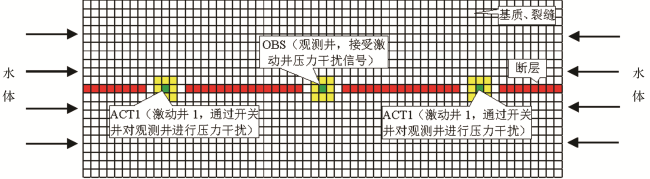
| 三重介质 | 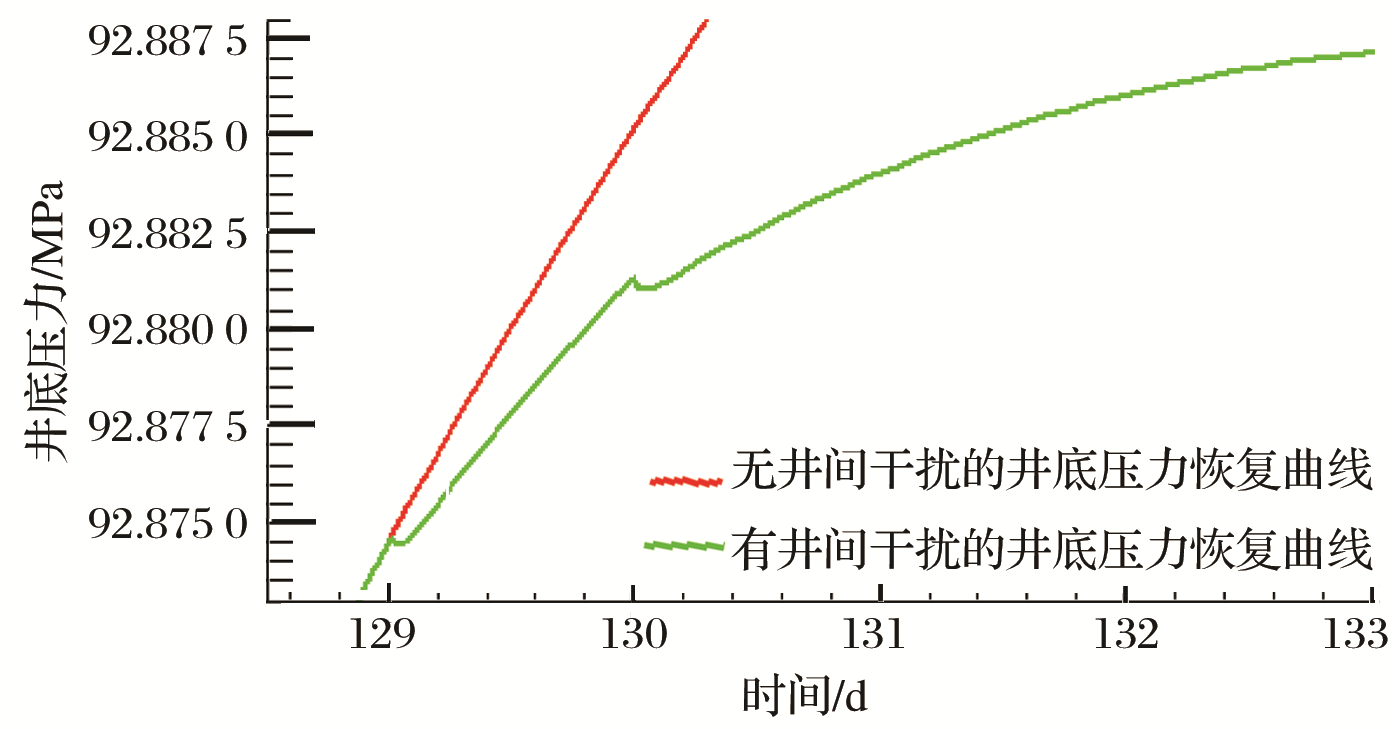 | 1.85 | 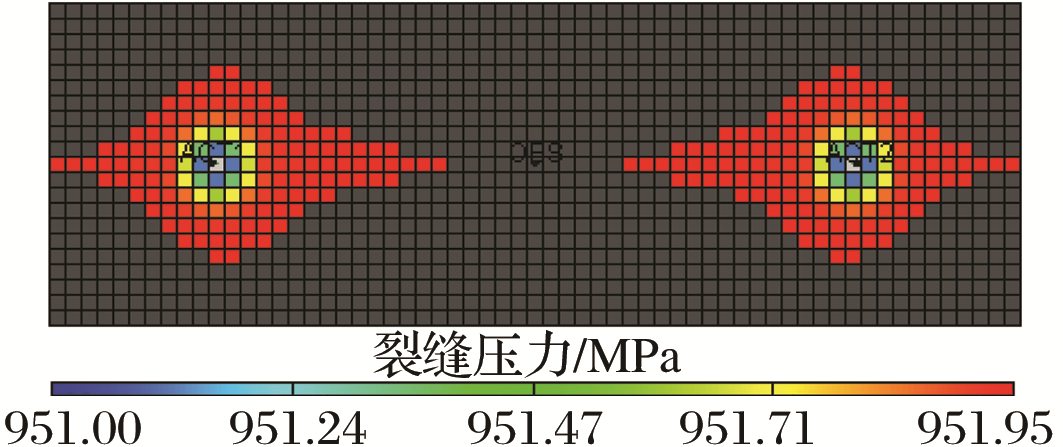 激动井压力优先沿断层传播,同时也沿径向传播,速度快,干扰强度先强后弱,观测井压力恢复曲线呈现“驼峰”状上升特征 |
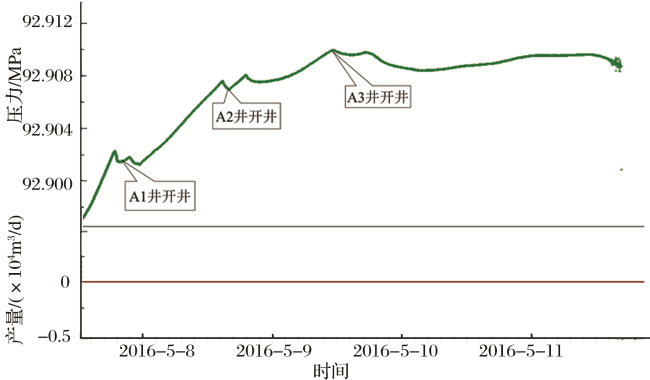
图6 克深2气藏K1井干扰试井压力恢复曲线Fig.6 Build up curve of interference well testing of Well K1 in Keshen 2 gas reservoir |
表2 克深2气藏K1井井组干扰试井数据Table 2 Interference well testing data of Well K1 group in Keshen 2 gas reservoir |
| 序号 | 激动井 | 距离 /m | 开井产气量 /(×104m3/d) | 压力传播 | |
|---|---|---|---|---|---|
| 时间/s | 速度/(m/s) | ||||
| ① | A1 | 1 023 | 50 | 600 | 1.70 |
| ② | A2 | 858 | 29 | 360 | 2.38 |
| ③ | A3 | 1 375 | 33 | 660 | 2.08 |
2.3 水侵特征
表3 水侵特征数值模拟机理研究结果Table 3 Numerical simulation research results of water-invasion property |
| 机理 模型 | 水侵机理 | ||
|---|---|---|---|
| 裂缝渗透率平面分布 | 裂缝含气饱和度平面分布(2.6年后) | 边部井日产水曲线 | |
| 双重 介质 | 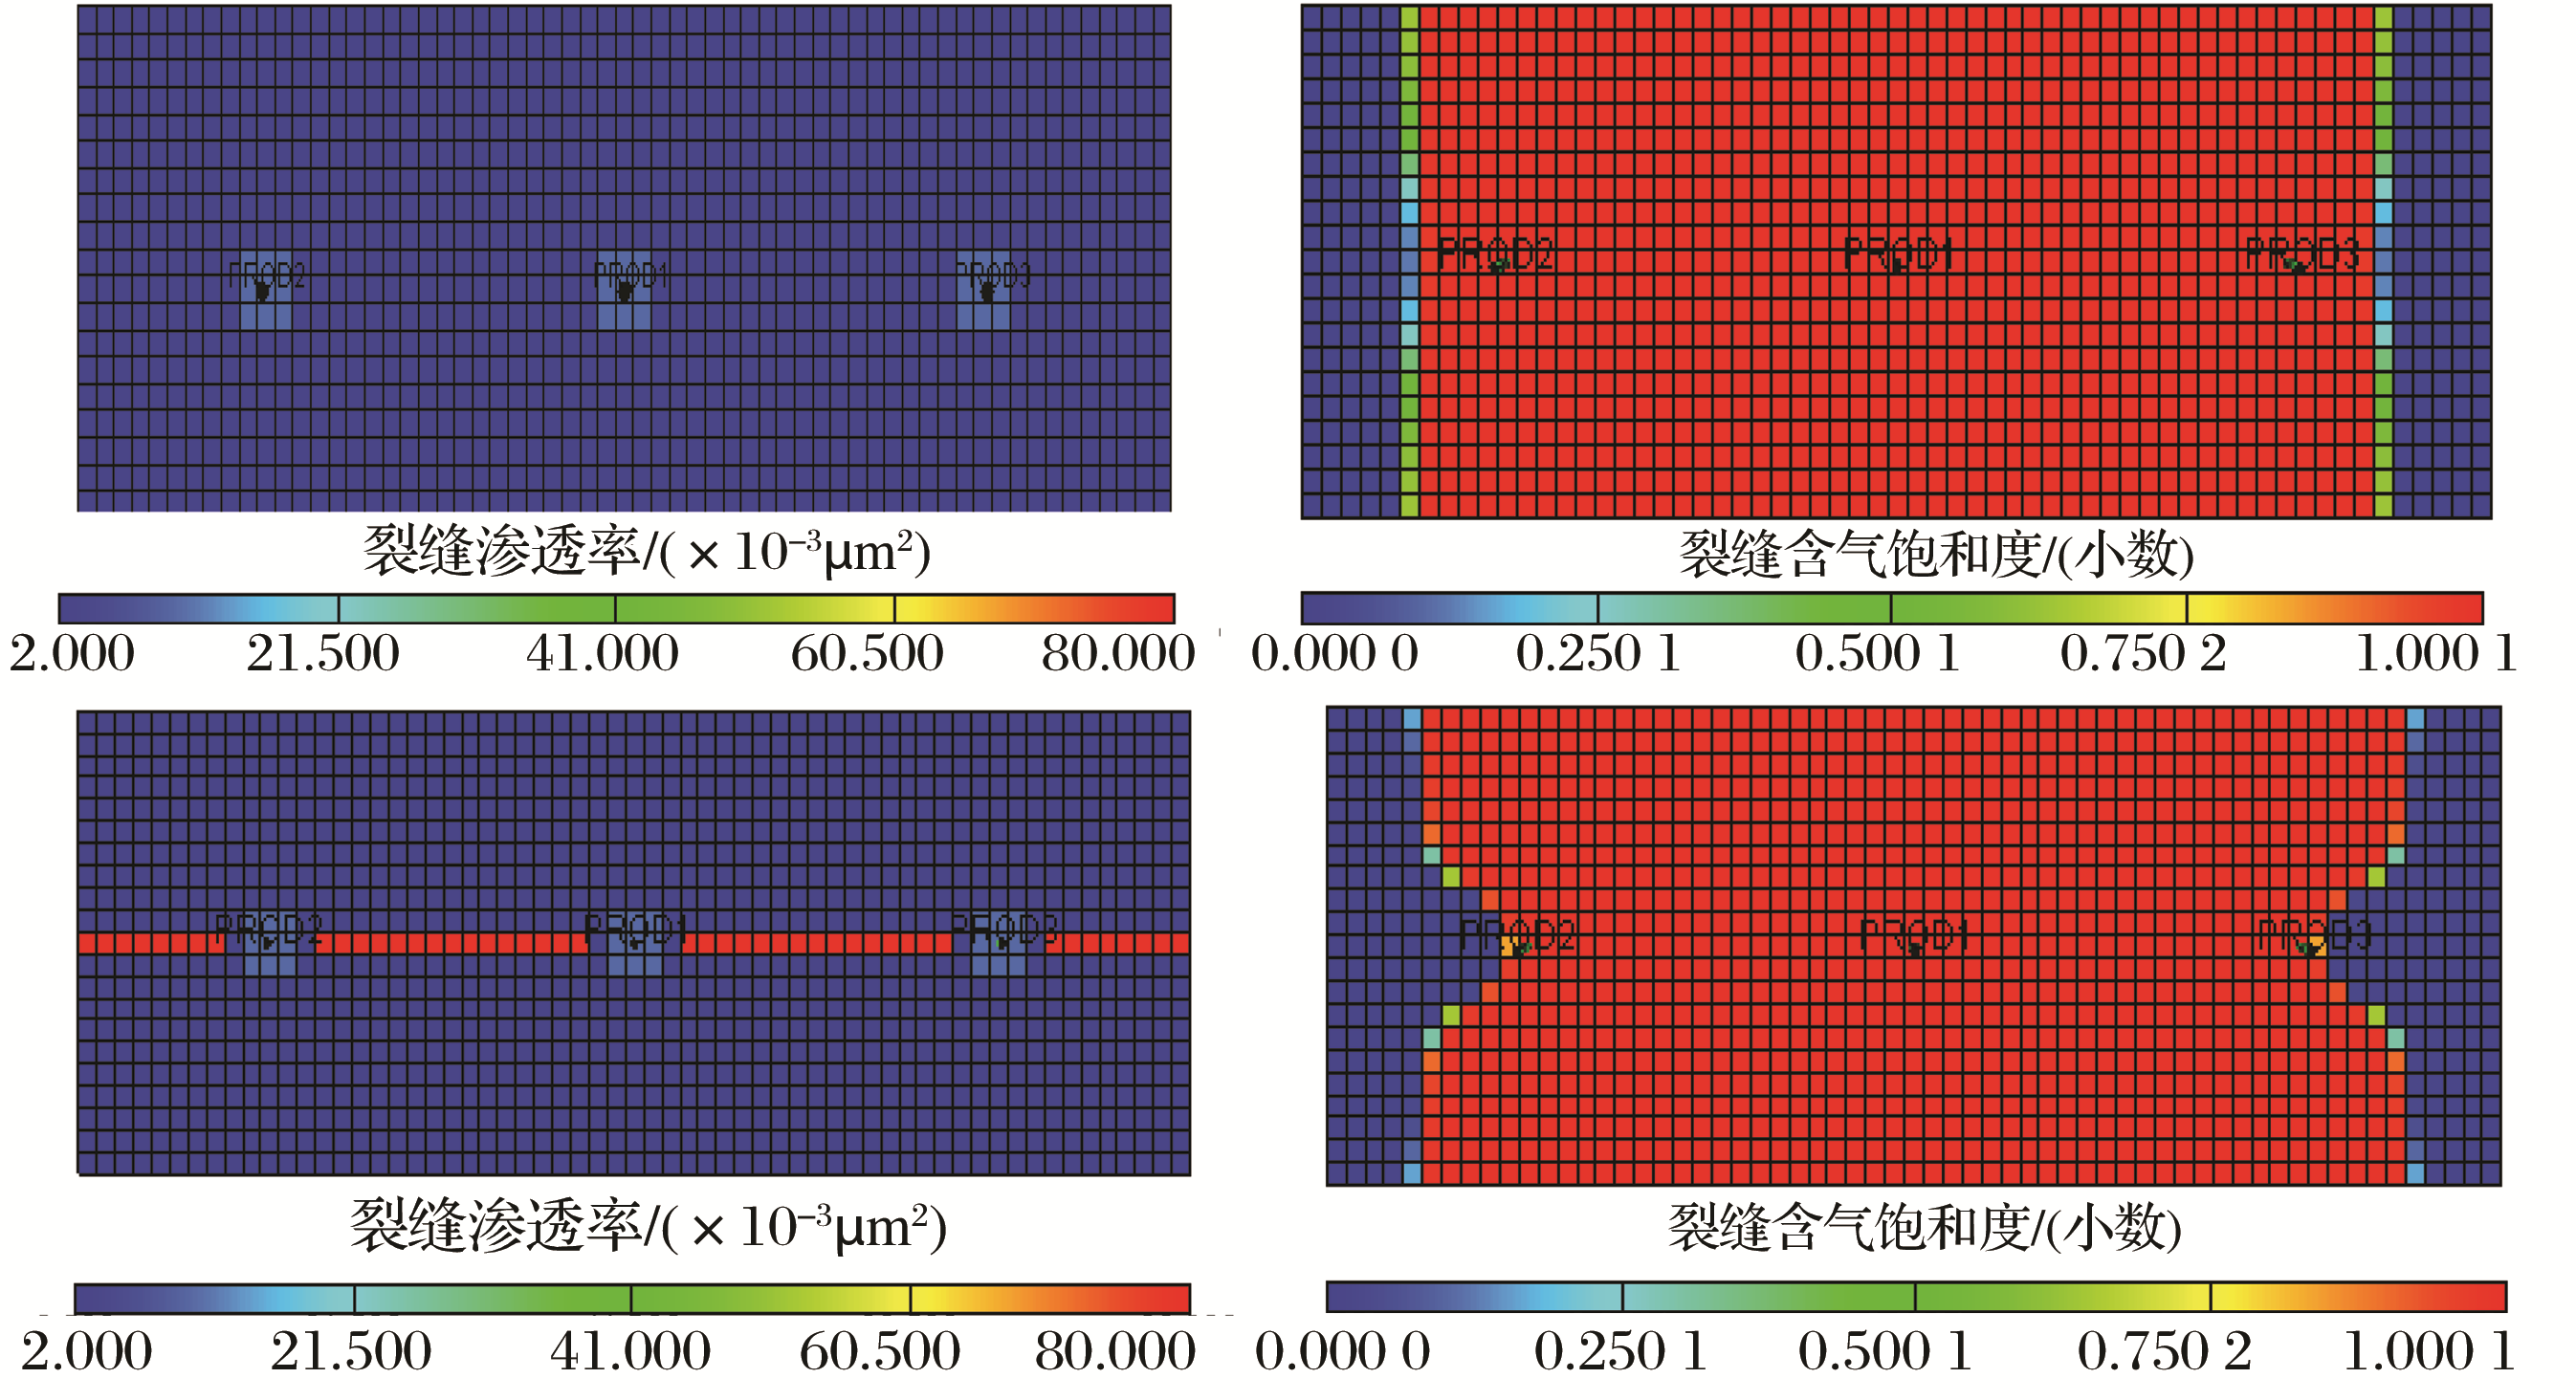 | 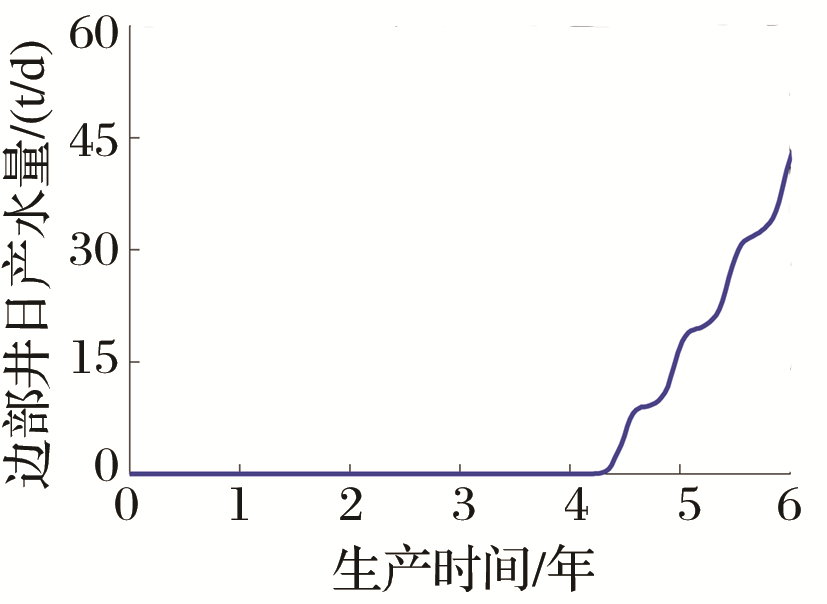 | |
| 三重 介质 | 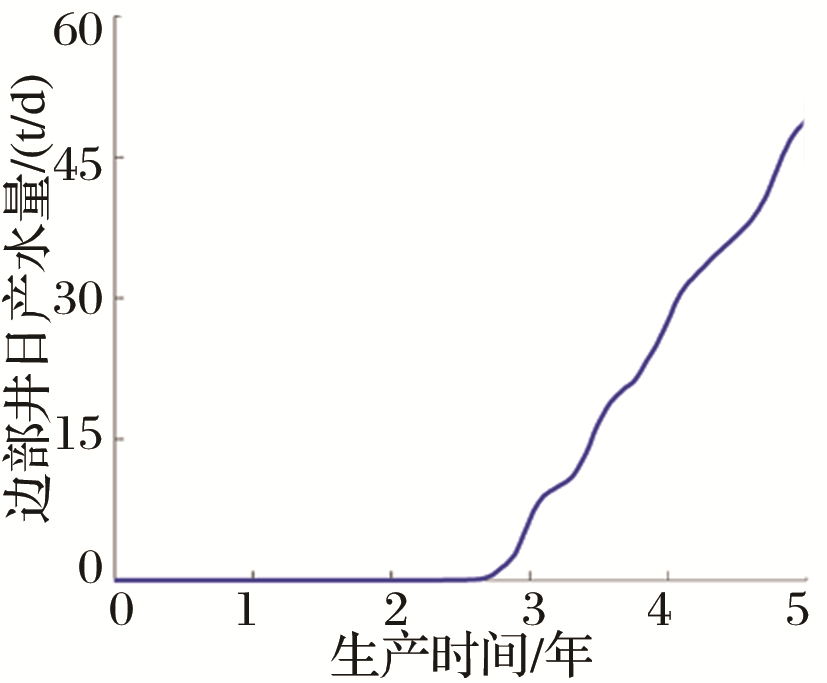 | ||
3 开发机理
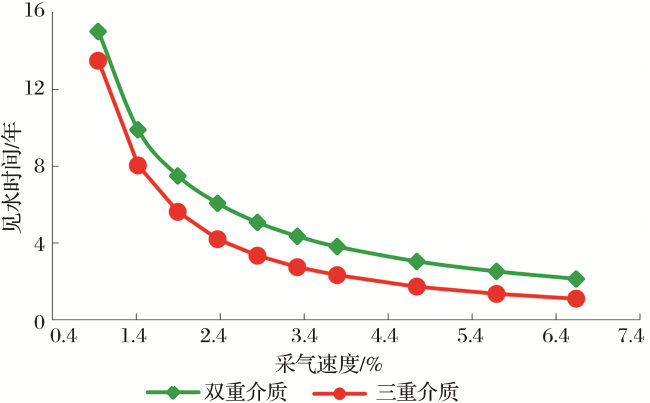
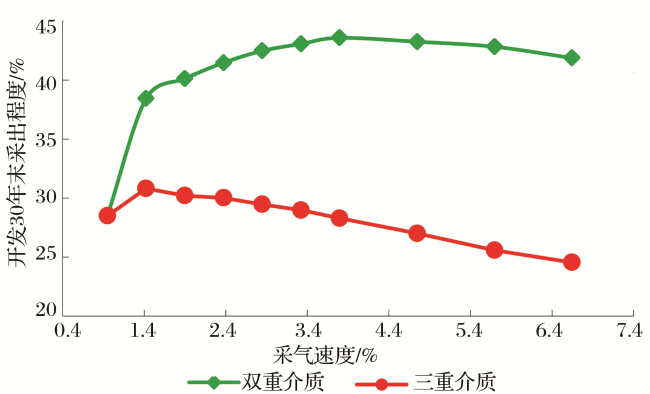
3.1 采气速度
3.2 配产方式
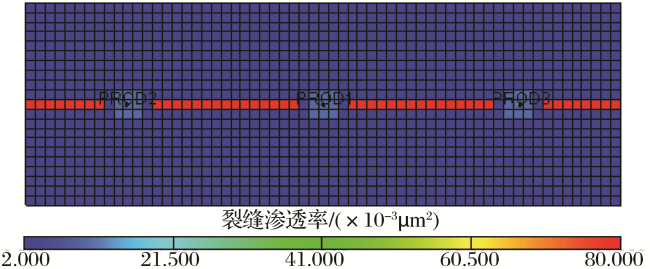
图9 井间、井与边水间均有断层机理模型Fig.9 Numerical simulation model for where there is fault developed in both inter-well and well between edge water |
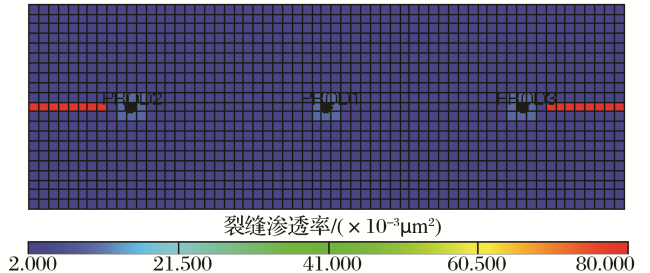
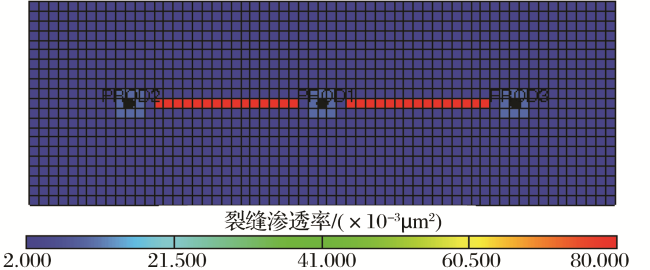
图10 井间有断层、井与边水间无断层机理模型Fig.10 Numerical simulation model for where there is fault developed in inter-well, no fault developed in well between edge water |
表4 不同配产条件下各模型预测开发指标对比Table 4 Results comparison table of forecasted development indexes for each model at different prorating production |
| 模型 | 方案 | 采气速度/ % | 单井配产/(×104m3/d) | 见水时间/年 | 无水期采出程度/% | 备注 | ||
|---|---|---|---|---|---|---|---|---|
| 边部井 | 中部井 | 边部井 | 中部井 | |||||
| 井间、井与边水间均有断层 | 均匀配产 | 2.4 | 25 | 25 | 4.18 | 8.29 | 9.92 | 均匀配产:边部、中部气井产量相同 非均匀配产:降低边部气井产量、提高中部气井产量,采速保持不变 |
| 非均匀配产 | 15 | 45 | 4.59 | 10.22 | 10.88 | |||
| 变化量 | -10 | 20 | 0.40 | 1.93 | 0.96 | |||
| 井间有断层、井与边水间无断层 | 均匀配产 | 2.4 | 25 | 25 | 6.22 | 11.22 | 14.61 | |
| 非均匀配产 | 15 | 45 | 6.54 | 12.22 | 15.24 | |||
| 变化量 | -10 | 20 | 0.33 | 1.00 | 0.63 | |||
| 井间无断层、井与边水间有断层 | 均匀配产 | 2.4 | 25 | 25 | 4.08 | 16.53 | 9.69 | |
| 非均匀配产 | 15 | 45 | 4.49 | 16.56 | 10.65 | |||
| 变化量 | -10 | 20 | 0.41 | 0.03 | 0.96 | |||
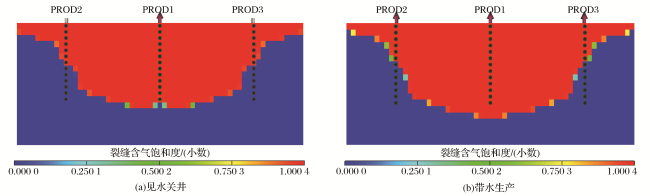
3.3 排水采气
表5 不同采气速度下各模型预测开发指标对比Table 5 Results comparison table of forecasted development indexes for each model at different gas recovery rate |
| 模型 | 采气速度/% | 见水时间/年 | 开发30年末采出程度/% | 开发30年末累产水/(×104t) | 备注 | |
|---|---|---|---|---|---|---|
| 边部井 | 中部井 | |||||
| 井间、井与边水间 均有断层 | 2.4 | 4.59 | 11.94 | 30.05 | 0.82 | 见水关井 |
| 4.59 | 14.00 | 35.26 | 23.19 | 带水生产 | ||
| 变化值 | 2.06 | 5.21 | 22.37 | |||
| 井间有断层、井与边水间无断层 | 2.4 | 6.54 | 13.15 | 32.72 | 0.80 | 见水关井 |
| 6.54 | 14.91 | 37.13 | 19.50 | 带水生产 | ||
| 变化值 | 1.76 | 4.40 | 18.70 | |||
| 井间无断层、井与边水间有断层 | 2.4 | 4.49 | 16.50 | 40.02 | 0.61 | 见水关井 |
| 4.49 | 17.17 | 41.49 | 21.55 | 带水生产 | ||
| 变化值 | 0.67 | 1.46 | 20.94 | |||
 甘公网安备 62010202000678号