


0 引言
1 天然气工业大发展的关键依据及重要条件
1.1 中国天然气资源丰富而探明率低,具备更快发展天然气的资源优势
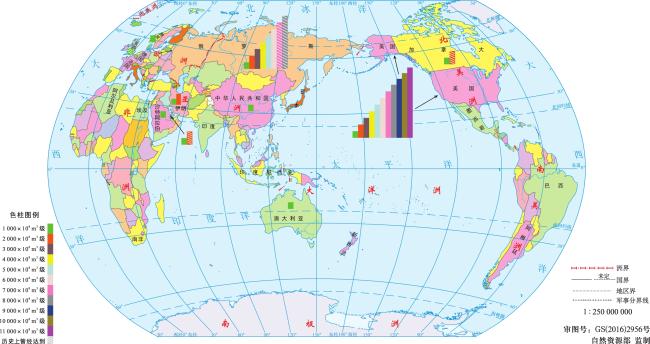
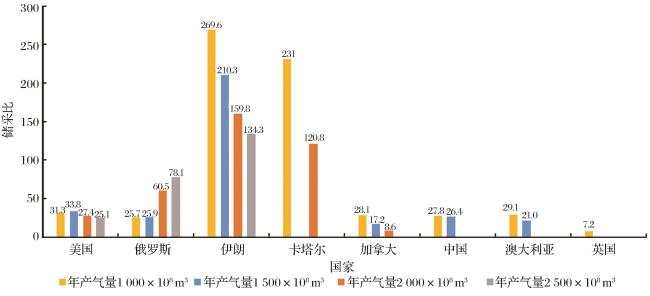
图1 世界年产气量1 000×108 m3以上十国分布(国家位置不同色柱代表该国历年曾经达到的产量级别,色柱加斜线则表示历年曾经达到但现在没达到的产量级别)Fig.1 Distribution map of the ten countries with annual gas output of more than 1 000×108 m3 in the world(The color bars for different countries indicate the production levels achieved in previous years, the slash bars indicate the production levels that have been achieved in previous years but are not reached now) |
表1 世界年产气量1 000×108 m3级以上的十大产气国重要勘探开发参数Table 1 Important exploration and development parameters of the world's top ten gas producing countries with an annual production capacity of over 1 000×108 m3 |
| 国家 | 总可采资源量[5]/(1012 m3) | 2019年底 探明累计 可采储量 /(1012 m3) | 2019年 | 年产1 000×108 m3级 | 沉积岩 面积[10]/(104 km2) | 总可采 资源丰度 /(104 m3/km2) | 探明累计可采 储量丰度 /(104 m3/km2) | 探明 率 /% | ||||
|---|---|---|---|---|---|---|---|---|---|---|---|---|
| 常规 | 非常规 | 总量 | 产量[7]/(108 m3) | 排名 | 产量 /(108 m3) | 年份 | ||||||
| 美国 | 31.9 | 39.0 | 70.9 | 52.454 9 | 11 579.4[8] | 1 | 995 | 1943 | 803 | 882.9 | 653.2 | 74.0 |
| 俄罗斯 | 123.8 | 30.0 | 153.8 | 76.247 0 | 6 790.4 | 2 | 1 086 | 1964 | 1 060 | 1 450.9 | 719.3 | 49.6 |
| 伊朗 | 65.2 | 11.9 | 77.1 | 36.492 6 | 2 441.6 | 3 | 994.8 | 2008 | 67.7 | 11 388.5 | 5 390.3 | 47.3 |
| 卡塔尔 | 53.0 | 0 | 53.0 | 25.938 8 | 1 781.3 | 4 | 1 098 | 2010 | 4.3 | 123 255.8 | 60 322.8 | 48.7 |
| 中国 | 48.4 | 37.0 | 85.4[5] | 7.365 7 | 1 761.7[9] | 5 | 1 027.1 | 2011 | 574.8 | 1 485.7 | 128.1 | 8.6 |
| 加拿大 | 14.7 | 15.8 | 30.5 | 9.046 7 | 1 731.0 | 6 | 987 | 1987 | 647.5 | 471.0 | 139.7 | 29.7 |
| 澳大利亚 | 11.4 | 14.5 | 25.9 | 4.672 9 | 1 534.6 | 7 | 1 104.2 | 2017 | 630 | 411.1 | 74.2 | 18.0 |
| 挪威 | 7.0 | 0 | 7.0 | 3.712 4 | 1 143.9 | 8 | 991.6 | 2008 | 13.1 | 5 343.5 | 2 833.9 | 53.0 |
| 沙特 | 20.4 | 8.9 | 29.3 | 10.658 3 | 1 136.4 | 9 | 992.3 | 2015 | 149 | 1 966.4 | 715.3 | 36.4 |
| 英国 | 6.6 | 0 | 6.6 | 1.974 4 | 396.3 | 19 | 958.7 | 1998 | 37.4 | 1 764.7 | 527.9 | 29.9 |
|
1.2 中国天然气产量持续增长,具备更快发展天然气的增长优势
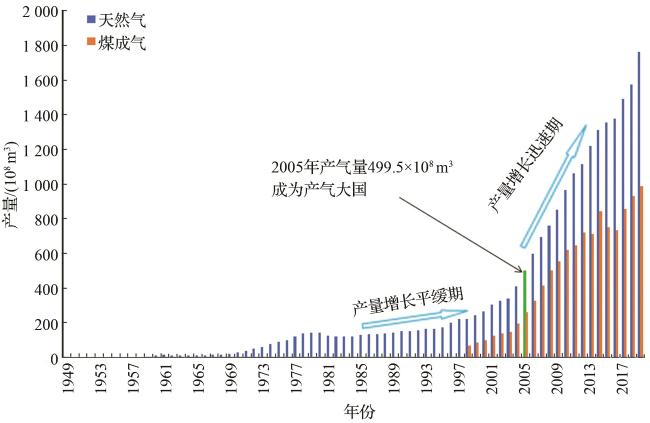
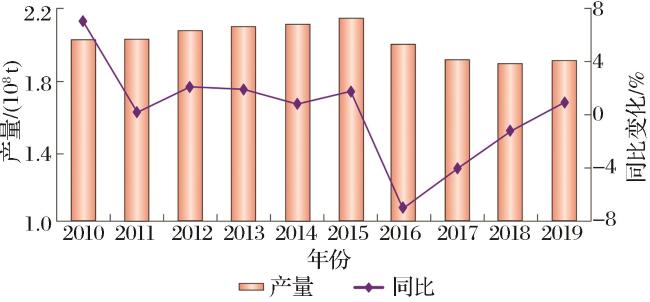
图2 1949—2019年中国天然气(包括煤成气)年产量统计及产量增长阶段划分Fig.2 Annual production statistics of natural gas (including coal-derived gas) in China from 1949 to 2019 and division of production growth stages |
表2 近十年来世界主要天然气产气大国年新增天然气产量Table 2 New annual natural gas production in the world's major natural gas producing countries over the past decade |
| 国家 | 新增天然气产量/(108 m3) | |||||||||
|---|---|---|---|---|---|---|---|---|---|---|
| 2010年 | 2011年 | 2012年 | 2013年 | 2014年 | 2015年 | 2016年 | 2017年 | 2018年 | 2019年 | |
| 美国 | 146.80 | 458.90 | 440.70 | -32.00 | 439.70 | 474.20 | -128.80 | 21.20 | 2 509.91 | 1 010.03 |
| 俄罗斯 | 1 089.30 | 142.40 | 19.80 | 279.70 | -328.00 | 5.20 | 39.30 | 430.50 | -140.77 | 99.32 |
| 伊朗 | 402.70 | 340.60 | -109.00 | -21.20 | 0.00 | 0.00 | 0.30 | -0.30 | 803.17 | 58.28 |
| 卡塔尔 | 348.40 | 72.90 | 25.50 | -7.10 | 854.00 | -159.70 | -14.70 | 367.70 | -471.73 | 16.41 |
| 中国 | 115.90 | 63.00 | 41.60 | 98.30 | 131.10 | 44.50 | 22.60 | 111.60 | 122.40 | 159.00 |
| 加拿大 | -12.70 | 8.00 | -50.50 | 36.90 | 15.50 | 41.30 | 135.10 | 126.50 | 36.72 | -59.27 |
| 澳大利亚 | 28.80 | -2.90 | 34.50 | 21.90 | 79.80 | -54.80 | 32.40 | 541.60 | 196.83 | 233.61 |
| 挪威 | 25.20 | -50.40 | 129.30 | -55.60 | -3.20 | 109.40 | 30.00 | 20.50 | -30.03 | -69.01 |
| 沙特 | -18.30 | 59.90 | 68.80 | 10.50 | 0.00 | 0.00 | 0.00 | 0.00 | 271.50 | 15.44 |
| 英国 | -27.30 | -120.70 | -87.60 | -43.30 | 0.00 | 0.00 | 5.90 | 32.70 | 21.59 | -8.90 |
1.3 中国天然气剩余可采储量逐年上扬,具备更快发展天然气的储量优势
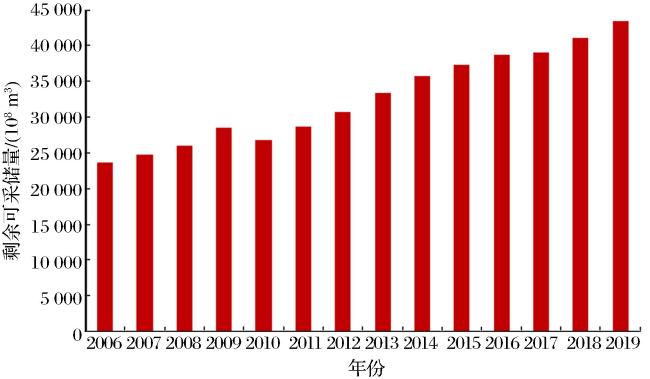
图3 中国“十一五”至“十三五”期间历年天然气剩余可采储量统计Fig.3 Statistics of China's remaining recoverable natural gas reserves from the 11th to the 13th five-year plans |
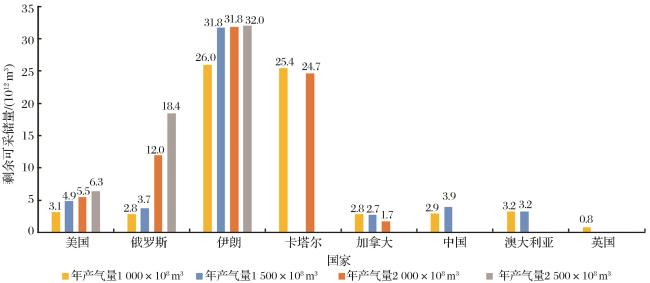
1.4 预测2025年中国年产气量达2 500×108 m3级
表3 不同学者对中国未来天然气年产量预测Table 3 Different scholars forecast the future annual production of natural gas in China |
1.4.1 近10年天然气产量增长率表明中国具备上产2 500×108 m3级趋势
1.4.2 中国天然气剩余可采储量具备上产2 500×108 m3级条件
1.4.3 天然气储采比支持中国上产2 500×108 m3级
1.5 “十四五”中国将成为热值当量天然气超过石油的产气大国
2 天然气勘探开发建议
2.1 开辟鄂尔多斯盆地石炭系—二叠系煤系泥页岩气藏勘探新领域
表4 鄂尔多斯盆地2015—2019年产气井数、产气量和单井日产量Table 4 The number of gas wells, gas production and daily production per well in Ordos Basin from 2015 to 2019 |
| 年份 | 天然气井数/口 | 当年天然气产量/(108 m3) | 天然气井单井日产量/[m3/(d·口)] |
|---|---|---|---|
| 2015 | 11 841 | 421.45 | 9 751.35 |
| 2016 | 12 527 | 417.07 | 9 121.56 |
| 2017 | 14 171 | 424.45 | 8 206.03 |
| 2018 | 16 979 | 451.76 | 7 289.58 |
| 2019 | 18 675 | 494.08 | 7 248.43 |
2.2 攻克3个隐伏煤系广布的潜在大气区
2.2.1 攻克北天山山前坳陷隐伏中-下侏罗统煤系潜在大气区
2.2.2 攻克柴北坳陷隐伏中-下侏罗统煤系潜在大气区
2.2.3 攻克西湖凹陷隐伏古近系—新近系煤系潜在大气区
2.3 加速陵水17-2气田等探明地质储量1 000×108 m3以上的7个大气田的开发,增加年产气100×108 m3
2.4 增加气井和超深层气探井的钻探
表5 美国1989—2019年气井产量、气井数和单井日产量Table 5 The gas production, number of gas wells and daily gas production per well in the United States from 1989 to 2019 |
| 年份 | 气井产量/(108 m3) | 在产井数/口 | 单井日产量/[m3/(d·口)] | 年份 | 气井产量/(108 m3) | 在产井数/口 | 单井日产量/[m3/(d·口)] |
|---|---|---|---|---|---|---|---|
| 1989 | 4 448.25 | 262 483 | 4 642.96 | 2005 | 4 947.47 | 425 887 | 3 182.70 |
| 1990 | 4 545.86 | 269 790 | 4 616.33 | 2006 | 5 095.77 | 440 516 | 3 169.24 |
| 1991 | 4 535.68 | 276 987 | 4 486.32 | 2007 | 5 375.04 | 452 945 | 3 251.20 |
| 1992 | 4 577.38 | 276 014 | 4 543.52 | 2008 | 5 670.96 | 476 652 | 3 259.59 |
| 1993 | 4 726.40 | 282 152 | 4 589.38 | 2009 | 5 771.75 | 493 100 | 3 206.86 |
| 1994 | 4 913.27 | 291 773 | 4 613.52 | 2010 | 5 941.26 | 487 627 | 3 338.09 |
| 1995 | 4 893.72 | 298 541 | 4 490.99 | 2011 | 6 391.42 | 574 593 | 3 047.50 |
| 1996 | 5 022.65 | 301 811 | 4 559.37 | 2012 | 6 959.28 | 577 916 | 3 299.18 |
| 1997 | 5 052.87 | 310 971 | 4 451.69 | 2013 | 6 829.41 | 572 742 | 3 266.87 |
| 1998 | 5 020.15 | 316 929 | 4 339.72 | 2014 | 7 194.01 | 586 213 | 3 362.19 |
| 1999 | 4 980.98 | 302 421 | 4 512.43 | 2015 | 7 469.13 | 574 530 | 3 561.76 |
| 2000 | 5 019.46 | 341 678 | 4 024.82 | 2016 | 7 420.84 | 571 659 | 3 556.50 |
| 2001 | 5 133.67 | 373 304 | 3 767.67 | 2017 | 7 666.69 | 539 875 | 3 890.65 |
| 2002 | 5 038.94 | 387 772 | 3 560.16 | 2018 | 9 294.16 | 512 675 | 4 966.78 |
| 2003 | 5 063.56 | 393 327 | 3 527.03 | 2019 | 10 269.98 | 491 205 | 5 728.14 |
| 2004 | 5 064.53 | 406 147 | 3 416.36 |
表6 中石油及其长庆油田、西南油气田和塔里木油田分公司2010-2019年气井产量、气井数和单井日产量Table 6 Gas well production, number of gas wells and daily production per well of PetroChina and its Changqing, Southwest and Tarim oilfields branch companies from 2010 to 2019 |
| 年份 | 中石油 | 中石油长庆油田公司 | |||||
|---|---|---|---|---|---|---|---|
| 气井产量/(108 m3) | 在产井数/口 | 单井日产量/ [m3/(d·口)] | 气井产量/(108 m3) | 在产井数/口 | 单井日产量/ [m3/(d·口)] | ||
| 2010 | 658.23 | 7 220 | 24 977.29 | 209.74 | 4 354 | 13 197.96 | |
| 2011 | 694.15 | 8 402 | 22 634.72 | 256.73 | 5 388 | 13 054.49 | |
| 2012 | 736.57 | 9 847 | 20 493.52 | 287.39 | 6 531 | 12 055.78 | |
| 2013 | 825.10 | 11 230 | 20 129.44 | 344.18 | 7 700 | 12 246.34 | |
| 2014 | 890.59 | 12 617 | 19 338.87 | 378.67 | 9 009 | 11 515.59 | |
| 2015 | 895.96 | 13 325 | 18 421.63 | 371.90 | 9 762 | 10 437.39 | |
| 2016 | 922.71 | 14 065 | 17 973.50 | 358.04 | 10 542 | 9 305.06 | |
| 2017 | 980.50 | 15 366 | 17 482.13 | 366.77 | 11 803 | 8 513.41 | |
| 2018 | 1 040.06 | 17 938 | 15 885.22 | 385.15 | 13 932 | 7 573.89 | |
| 2019 | 1 129.91 | 20 069 | 15 424.97 | 411.34 | 15 839 | 7 115.09 | |
| 年份 | 中石油西南油气田公司 | 中石油塔里木油田公司 | |||||
| 气井产量/(108 m3) | 在产井数/口 | 单井日产量/ [m3/(d·口)] | 气井产量/(108 m3) | 在产井数/口 | 单井日产量/ [m3/(d·口)] | ||
| 2010 | 153.62 | 1 377 | 30 563.92 | 174.19 | 213 | 224 054.15 | |
| 2011 | 142.06 | 1 394 | 27 920.44 | 164.90 | 243 | 185 919.61 | |
| 2012 | 131.52 | 1 505 | 23 941.78 | 188.84 | 302 | 171 316.52 | |
| 2013 | 126.08 | 1 543 | 22 386.65 | 217.90 | 332 | 179 813.58 | |
| 2014 | 137.26 | 1 510 | 24 904.25 | 230.34 | 383 | 164 766.26 | |
| 2015 | 154.84 | 1 388 | 30 562.53 | 233.61 | 386 | 165 811.91 | |
| 2016 | 190.06 | 1 248 | 41 724.64 | 233.80 | 405 | 158 160.80 | |
| 2017 | 210.25 | 1 220 | 47 214.46 | 251.58 | 395 | 174 494.75 | |
| 2018 | 226.33 | 1 277 | 48 557.06 | 263.94 | 440 | 164 348.57 | |
| 2019 | 268.65 | 1 418 | 51 905.75 | 281.31 | 429 | 179 653.16 | |
 甘公网安备 62010202000678号