0 引言
1 实验与方法
1.1 样品
表 1 页岩样品岩石物理信息Table 1 Petrophysical information of the selected shale samples |
| 样品 编号 | 层位 | 黏土矿物 含量/% | 脆性矿物 含量/% | TOC /% | 核磁孔隙度 /% |
|---|---|---|---|---|---|
| Y-1 | 龙马溪组 | 22.5 | 61.4 | 0.8 | 8.58 |
| Y-2 | 龙马溪组 | 27.9 | 49.3 | 0.7 | 8.00 |
| Y-3 | 龙马溪组 | 17.7 | 46.9 | 3.2 | 3.71 |
| Y-4 | 龙马溪组 | 24.7 | 44.6 | 1.9 | 7.28 |
| Y-5 | 龙马溪组 | 20.3 | 43.7 | 1.7 | 10.27 |
| Y-6 | 龙马溪组 | 14.4 | 47.4 | 1.7 | 6.45 |
| Y-7 | 五峰组 | 3.3 | 27.2 | 2.0 | 5.98 |
| Y-8 | 五峰组 | 16.5 | 20.7 | 4.6 | 2.71 |
| Y-9 | 五峰组 | 38.0 | 42.9 | 4.8 | 8.07 |
表 2 煤样品岩石物理信息Table 2 Petrophysical information of the selected coal samples |
| 样品编号 | 层位 | 总有机质含量/% | 镜质组含量/% | R O/% | 氦测孔隙度/% | 渗透率/(10-3 μm2) |
|---|---|---|---|---|---|---|
| M-1 | 山西组 | 81.6 | 71.9 | 1.4 | 1.7 | 0.002 7 |
| M-2 | 山西组 | 76.7 | 82.3 | 1.4 | 5.6 | 0.329 3 |
| M-3 | 太原组 | 83.4 | 86.0 | 1.5 | 1.3 | 0.105 0 |
| M-4 | 本溪组 | 84.2 | 91.4 | 1.5 | 1.3 | 0.005 3 |
| M-5 | 本溪组 | 76.6 | 83.7 | 1.7 | 2.4 | 0.001 1 |
| M-6 | 本溪组 | 77.9 | 79.2 | 1.7 | 1.2 | 0.155 1 |
| M-7 | 本溪组 | 80.5 | 87.2 | 1.8 | 1.4 | - |
1.2 实验方法
2 微孔分形维数计算方法
3 实验结果与讨论
3.1 微孔分形维数
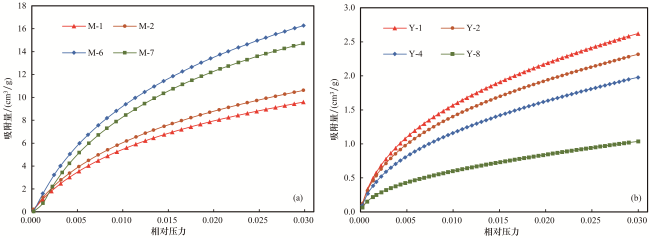
表3 煤、页岩样品ρ、v参数拟合结果Table 3 The value of ρ and v of the coal and shale samples |
| 样品编号 | ρ/(kJ·mol) | v | 样品编号 | ρ/(kJ·mol) | v |
|---|---|---|---|---|---|
| M-1 | 13.00 | 2.05 | Y-1 | 14.63 | 2.03 |
| M-2 | 13.16 | 2.05 | Y-2 | 14.81 | 1.98 |
| M-3 | 13.33 | 2.08 | Y-3 | 15.05 | 2.02 |
| M-4 | 13.22 | 2.09 | Y-4 | 15.13 | 2.08 |
| M-5 | 12.92 | 1.99 | Y-5 | 15.02 | 2.00 |
| M-6 | 10.36 | 2.08 | Y-6 | 14.98 | 2.05 |
| M-7 | 9.55 | 2.10 | Y-7 | 15.04 | 2.03 |
| Y-8 | 15.87 | 2.09 | |||
| Y-9 | 15.03 | 1.98 |
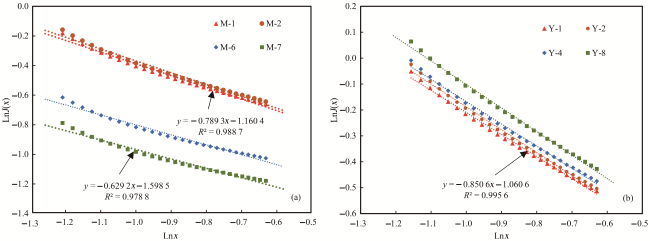
图4 煤(a)和页岩(b)样品J(x)和x双对数曲线Fig.4 Plots of Ln(x) vs Ln(J(x)) reconstructed from CO2 adsorption isotherms of coal (a) and shale (b) samples |
表4 煤、页岩样品微孔分形维数模型拟合公式与相关系数Table 4 Fitting formula and correlation coefficient of micropore fractal dimension(MFD) model of coal and shale samples |
| 样品编号 | 拟合公式 | R 2 | 样品编号 | 拟合公式 | R 2 |
|---|---|---|---|---|---|
| M-1 | y=-0.781 3x-1.172 4 | 0.988 3 | Y-1 | y=-0.850 6x-1.060 6 | 0.995 6 |
| M-2 | y=-0.789 3x-1.160 4 | 0.988 7 | Y-2 | y=-0.882 4x-1.070 7 | 0.995 9 |
| M-3 | y=-0.784 8x-1.141 7 | 0.988 8 | Y-3 | y=-0.881 6x-1.050 6 | 0.996 1 |
| M-4 | y=-0.775 9x-1.148 6 | 0.988 5 | Y-4 | y=-0.858 5x-1.026 6 | 0.996 1 |
| M-5 | y=-0.804 9x-1.191 7 | 0.988 6 | Y-5 | y=-0.888 4x-1.058 6 | 0.996 1 |
| M-6 | y=-0.663 7x-1.466 8 | 0.981 3 | Y-6 | y=-0.860 5x-1.039 5 | 0.995 9 |
| M-7 | y=-0.629 2x-1.598 5 | 0.978 8 | Y-7 | y=-0.874 8x-1.046 3 | 0.996 1 |
| Y-8 | y=-0.908 6x-1.010 3 | 0.996 9 | |||
| Y-9 | y=-0.897 2x-1.065 0 | 0.996 1 |
表5 煤和页岩样品微孔分形维数计算结果Table 5 Micropore fractal dimensions of coal and shale samples by the MFD model |
| 样品编号 | V 0 /(cm³/g ) | 比表面积/(m²/g) | D m | 样品编号 | V 0 /(cm³/g ) | 比表面积/(m²/g) | D m |
|---|---|---|---|---|---|---|---|
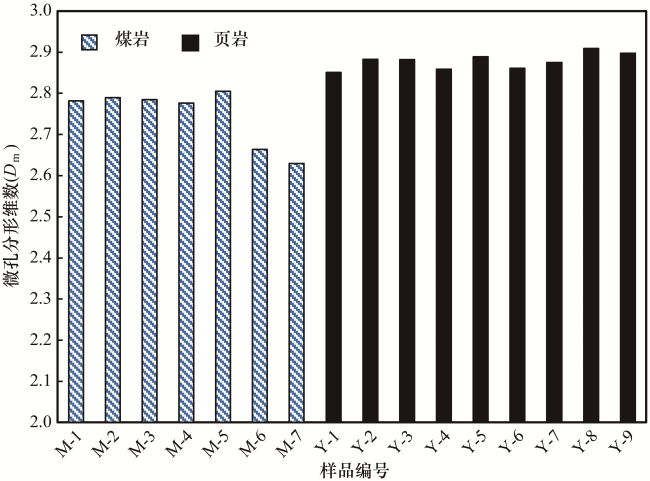
| M-1 | 21.95 | 100.23 | 2.78 | Y-1 | 4.78 | 21.85 | 2.85 |
| M-2 | 23.77 | 108.55 | 2.79 | Y-2 | 4.12 | 18.80 | 2.88 |
| M-3 | 37.82 | 172.67 | 2.78 | Y-3 | 2.70 | 12.32 | 2.88 |
| M-4 | 36.93 | 168.64 | 2.78 | Y-4 | 3.50 | 15.97 | 2.86 |
| M-5 | 32.20 | 147.02 | 2.80 | Y-5 | 3.37 | 15.39 | 2.89 |
| M-6 | 60.14 | 274.59 | 2.66 | Y-6 | 3.60 | 16.43 | 2.86 |
| M-7 | 64.48 | 294.44 | 2.63 | Y-7 | 3.26 | 14.86 | 2.87 |
| Y-8 | 1.70 | 7.78 | 2.91 | ||||
| Y-9 | 4.36 | 19.93 | 2.90 |
|
3.2 表面粗糙分形维数
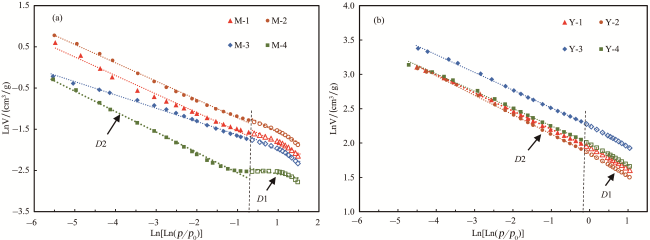
图7 利用FHH模型拟合煤(a)与页岩(b)吸附数据Fig.7 Plots of Ln(Ln(p 0/p)) vs LnV reconstructed from N2 adsorption isotherms of coal (a) and shale (b) samples |
表6 煤、页岩样品FHH拟合公式与相关系数Table 6 Fitting formula and correlation coefficient of FHH model of coal and shale samples |
| 样品编号 | D1 | D2 | ||
|---|---|---|---|---|
| 拟合公式 | R 2 | 拟合公式 | R 2 | |
| M-1 | y=-0.480 1x-1.341 4 | 0.967 7 | y=-0.449 3x-1.458 6 | 0.997 6 |
| M-2 | y=-0.459 5x-1.793 4 | 0.941 5 | y=-0.321 5x-1.793 2 | 0.994 3 |
| M-3 | y=-0.165 4x-2.500 8 | 0.606 3 | y=-0.504 1x-2.832 5 | 0.997 3 |
| M-4 | y=-0.095 0x-2.446 6 | 0.213 9 | y=-0.511 6x-2.936 6 | 0.993 8 |
| M-5 | y=-0.350 7x-1.493 3 | 0.925 5 | y=-0.505 8x-1.703 4 | 0.995 3 |
| M-6 | y=0.061 7x-2.321 5 | 0.146 9 | y=-0.675 8x-2.988 9 | 0.986 0 |
| M-7 | y=-0.454 7x-1.615 5 | 0.947 0 | y=-0.455 3x-1.785 1 | 0.989 4 |
| Y-1 | y=-0.332 3x+1.942 0 | 0.991 1 | y=-0.265 2x+1.934 6 | 0.998 9 |
| Y-2 | y=-0.346 2x+1.850 3 | 0.994 4 | y=-0.282 5x+1.847 5 | 0.998 8 |
| Y-3 | y=-0.326 0x+2.258 1 | 0.993 5 | y=-0.285 8x+2.255 0 | 0.998 5 |
| Y-4 | y=-0.330 7x+1.993 1 | 0.991 8 | y=-0.251 9x+1.997 9 | 0.997 6 |
| Y-5 | y=-0.334 4x+2.019 0 | 0.991 7 | y=-0.254 5x+2.031 7 | 0.996 7 |
| Y-6 | y=-0.310 4x+1.830 1 | 0.982 6 | y=-0.212 0x+1.867 6 | 0.980 7 |
| Y-7 | y=-0.303 1x+2.485 9 | 0.982 7 | y=-0.194 9x+2.518 8 | 0.989 3 |
| Y-8 | y=-0.328 3x+2.358 3 | 0.993 0 | y=-0.215 1x+2.374 6 | 0.999 6 |
| Y-9 | y=-0.304 7x+1.969 5 | 0.983 8 | y=-0.209 8x+1.999 0 | 0.989 8 |
表7 煤与页岩表面粗糙分形维数计算结果Table 7 Fractal dimensions of coal and shale derived from the FHH model |
| 样品编号 | V 0/(m3/g) | 比表面积/(m2/g) | D1 | D2 |
|---|---|---|---|---|
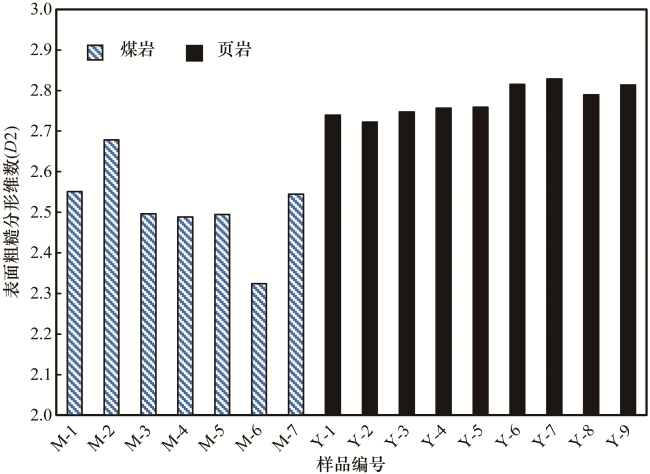
| M-1 | 0.18 | 0.79 | 2.52 | 2.55 |
| M-2 | 0.12 | 0.51 | 2.54 | 2.68 |
| M-3 | 0.06 | 0.26 | 2.83 | 2.50 |
| M-4 | 0.07 | 0.28 | 2.90 | 2.49 |
| M-5 | 0.16 | 0.70 | 2.65 | 2.49 |
| M-6 | 0.07 | 0.32 | 3.06 | 2.32 |
| M-7 | 0.14 | 0.61 | 2.55 | 2.54 |
| Y-1 | 4.68 | 20.39 | 2.71 | 2.74 |
| Y-2 | 4.26 | 18.52 | 2.69 | 2.72 |
| Y-3 | 6.43 | 27.99 | 2.71 | 2.75 |
| Y-4 | 4.93 | 21.46 | 2.71 | 2.76 |
| Y-5 | 5.05 | 22.00 | 2.70 | 2.76 |
| Y-6 | 4.21 | 18.32 | 2.73 | 2.82 |
| Y-7 | 8.12 | 35.36 | 2.74 | 2.83 |
| Y-8 | 7.12 | 30.98 | 2.72 | 2.79 |
| Y-9 | 4.84 | 21.08 | 2.73 | 2.81 |
|
3.3 煤和页岩分形维数对比
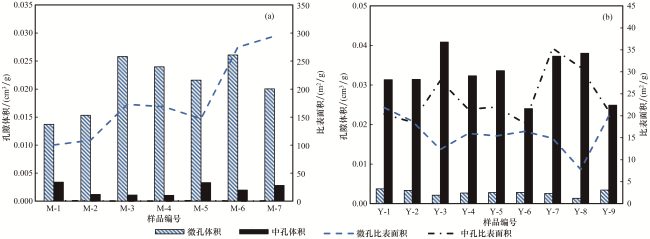
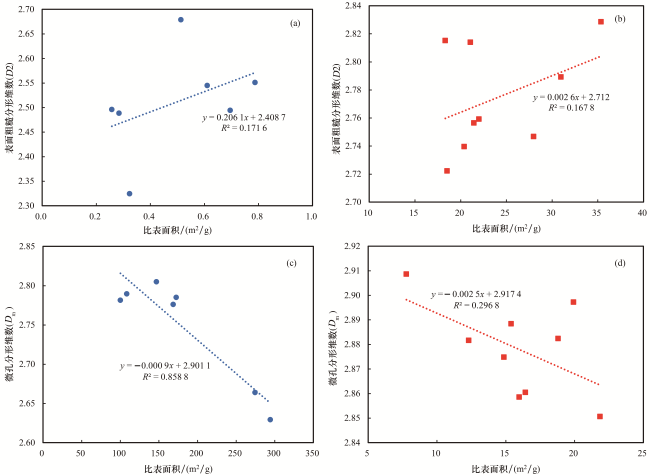
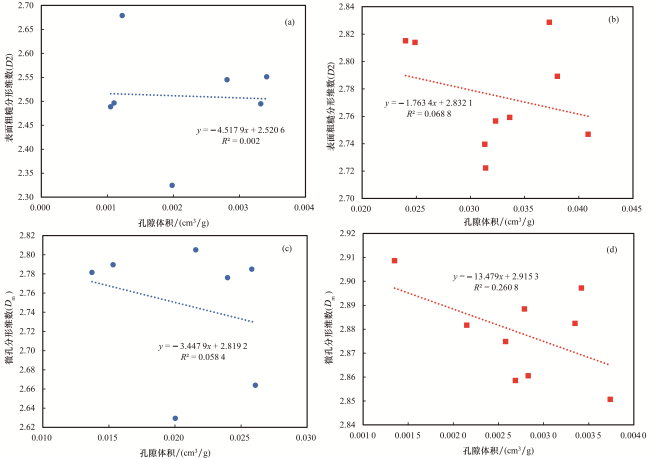
图9 煤与页岩分形维数与比表面积关系[(a)、(c):煤;(b)、(d):页岩]Fig.9 Plots of fractal dimension and specific surface area of coal [(a),(c)] and shale [(b),(d)] |


 甘公网安备 62010202000678号