


0 引言
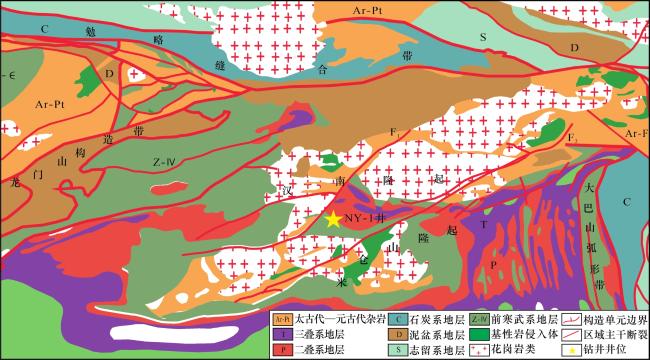
作为重要的非常规天然气资源之一,页岩气勘探受到广泛关注。我国页岩气资源十分丰富[1],总可采资源量达3.6×10¹³ m3,居世界首位[2]。页岩中烃类气体赋存形式不同,包括有机质表面的吸附态、大孔和裂缝中的游离态及液态烃中的溶解态[3-4],其中吸附态占比最大,介于20%~85%之间[5-6]。页岩气勘探开发在我国不同含油气盆地均已取得突破,主要包括四川盆地五峰组—龙马溪组页岩气及鄂尔多斯盆地延长组页岩气等[7-8],其中四川盆地是我国页岩气商业开发最成功的地区之一[9-10],川南地区4 500 m以浅五峰组—龙马溪组海相页岩的页岩气资源量为3.7×10¹² m3,其中可采储量超过2×10¹² m3,渝东北—鄂西地区、川西南—滇东北复杂构造区五峰组—龙马溪组海相页岩气资源潜力较好,亦具有良好的勘探开发前景。
高演化阶段页岩气有机组分以甲烷为主,乙烷和丙烷含量很少[11],对于无机组分,由于大气下渗、地壳含氮岩石高温变质及干酪根晚期热解,部分页岩气中也含有一定比例N2、CO2 [12-13]。N2、CH4、CO2三者分子动力学直径分别为0.36 nm、0.38 nm、0.33 nm,气体分子动力学直径增加,其扩散系数显著降低。而孔隙内气体分子的吸附能力与孔径和分子动力学直径存在耦合关系,因此,N2、CH4、CO2在同介质孔隙内的吸附能力存在差异[14-15]。总体而言,动力学直径小且可溶解于有机结构的CO2更易被吸附,因此三者在页岩中会存在竞争吸附行为。目前,国内外学者对页岩二组分气体吸附机理进行了大量研究。朱阳升等[16]、DUAN等[17]和NIU等[18]分别采用容量法、重量法吸附实验对页岩CH4/CO2竞争吸附进行了实验研究,结果表明,相对于CH4,CO2表现出更明显的优先吸附特征。LIU等[19]应用核磁共振实验,评估了CO2注入过程中吸附相和游离态甲烷的变化,发现注入CO2后甲烷回收效率显著提高。受实验条件的限制,模拟实验压力与实际页岩储层压力相差较大,应用分子动力学模拟方法研究微纳米条件下CO2/CH4竞争吸附特性[20-21],可以弥补实验分析的不足。WANG等[22]、JIN等[23]采用GCMC法研究了CH4/CO2在页岩干酪根上的竞争吸附,发现在页岩干酪根上CO2会比CH4优先吸附。王晓琦等[24]构建了页岩有机质层柱状分子模型,研究了CH4和CO2在模型中的分布和竞争吸附行为。邓佳等[25]采用非平衡分子动力学(NEMD)方法建立石墨烯微纳米孔隙模型,研究了微观流动状态下的CO2/CH4在微纳米孔隙的竞争吸附特性。此外也有学者基于CO2/CH4的竞争吸附,研究了页岩气储层CO2地质封存及注CO2提高页岩气采收率的可行性[26-29],CH4、N2、CO2之间的竞争吸附会导致置换行为,因此注入CO2或N2可提高页岩气产量[30-31]。
研究发现,四川盆地及周缘地区寒武系牛蹄塘组页岩气具有富含氮气的特征。因此,CH4/N2/CO2气体间的竞争吸附行为会造成页岩气吸附与游离态中气体化学成分分馏,从而影响页岩气含气性评价的准确性。因此,揭示页岩对CH4/N2/CO2气体之间的竞争吸附规律是准确评价页岩吸附能力与含气性的基础。然而,目前对页岩竞争吸附行为的实验研究主要采用静态容积法,仅能获取各气体组分吸附前后状态的特征,无法从各组分在吸附过程中的动态变化规律揭示混合气体组分之间的竞争关系与置换规律;另外,目前研究大多为CO2/CH4二组分间的竞争吸附,对页岩CH4/N2/CO2三组分间的竞争吸附规律则鲜有涉及。因此,本文研究以穿透曲线法为基础,采用高成熟页岩为吸附介质,以混合气体吸附—解吸装置来动态监测各气体组分在页岩竞争吸附过程中的变化规律,明确页岩对CH4/N2/CO2三组分气体的竞争吸附规律与置换关系,为我国南方下古生界页岩气的勘探开发提供理论依据,对其他部分地区页岩气组分中N2的成因具有一定指导意义。
1 样品与实验
1.1 样品
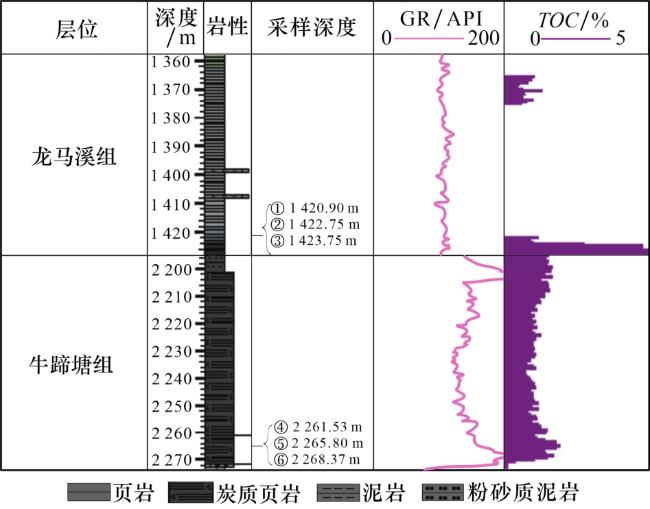
1.2 实验
1.2.1 混合气体竞争吸附实验系统与数据处理
本文实验研究以穿透曲线法为基础,采用混合气体吸附解吸装置(图3)对所选6个深度的岩样进行了CH4/N2/CO2三组分气体竞争吸附实验,装置简介如下:
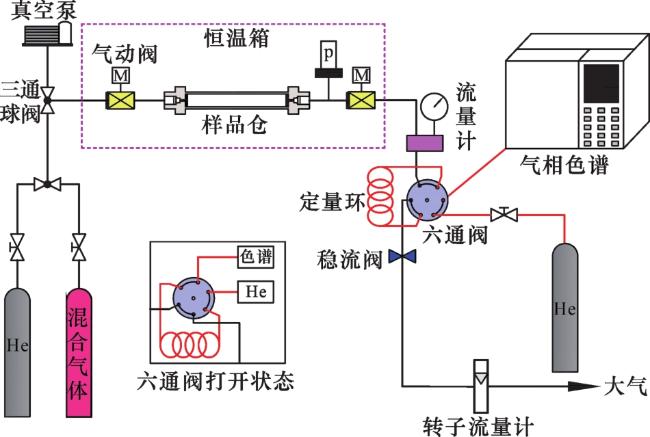
装置由供气系统、吸附系统、气体流量控制系统和检测系统4部分构成:
(1)供气系统:供气系统包括混合气体和纯氦气。混合气体中CH4、CO2、N2的浓度均为5%,其余85%为He,纯He用来在实验前对整个系统进行吹扫。供气压力可由减压阀调节,供气系统可通过三通阀在混合气体和纯氦气之间切换。
(2)吸附系统:吸附系统由2个气动阀和1个样品管组成,气动阀间安装了1个压力传感器来监测系统的压力,所有零件放置在Bluepard恒温箱中,用于在吸附过程中保持恒温。
(3)气体流量控制系统:气体出口处装有稳流阀,可用来调控气体的流量,恒温箱外接有质量流量计,可在电脑软件面板读取气体流量数值。
(4)检测系统:检测系统包括六通阀,样品回路和气相色谱仪(GC9790Ⅱ,浙江福立有限公司)。六通阀打开关闭时间可通过软件面板设定,由电磁阀对其进行切换,六通阀关闭时取样回路中的气体被收集在定量环内,当六通阀打开,里面的气体被He吹入色谱进行检测。
混合气体竞争吸附实验步骤如下:
(1)将所有岩样粉碎成60~80目的粉末。
(2)用真空干燥箱将岩样在70 ℃下干燥12 h,以去除岩样表面的吸附水。
(3)在完成预处理后,将岩样放入样品管中,置于恒温箱内,温度保持在20 ℃。
(4)在检查实验装置的气密性之后,将供气系统转换至纯He,待He充满系统及温度压力稳定后,关闭吸附系统与系统外连接的阀门,切换气路至真空系统,打开真空泵将系统抽至真空。切换气路至He并反复上述操作3~4次,保证系统内残留的吸附态气体被置换干净。
(5)将供气系统转换至混合气体,注气压力设定在0.25 MPa,通过流量计与稳流阀调整气体流速至1 mL/min。气体流过装有不同岩样颗粒的样品管,六通阀闭合时间为360 s,期间通过样品管后流出的气体被收集在六通阀上的定量环内,断开时间设置为40 s,六通阀将定量环内的气体送入色谱,通过工作站显示出的各峰高得到流出的混合气体各组分浓度动态变化情况。
在竞争吸附实验结束后,可以从色谱工作站得到不同时间混合气体各组分峰面积值。N2峰面积值为S i、CH4峰面积值为S j、CO2峰面积值为S k;吸附平衡时,N2的平衡峰面积为S ie、CH4平衡峰面积为S je、CO2平衡峰面积为S ke。N2、CH4、CO2初始浓度分别为C i0(%)、C j0(%)和C k0(%)。
t时刻出口处N2的浓度瞬时值由式(1) 计算:
t时刻出口处CH4的浓度瞬时值由式(2) 计算:
t时刻出口处CO2的浓度瞬时值由式(3) 计算:
1.2.2 N2与CO2吸附实验
页岩是一种具有孔裂隙的多孔介质,其孔隙演化受到生烃作用、成岩作用的共同控制。它能够以吸附的形式储集气体,吸附不同气体能力的差异和当中的孔裂隙结构有关。因此,仍需对各岩样进行低温N2与CO2吸附实验,以表征其孔隙结构,揭示竞争吸附微观机理。
使用Auto-sorb-IQ-MP(奥地利安东帕公司)装置,N2吸附在77.3 K下进行,相对压力(P/P 0)范围为0.001~0.998,CO2吸附在273 K下进行,P/P 0值范围为0.000 4~0.029。吸附测试前,称取每个样品3~5 g,在真空下110 ℃干燥至少10 h,以排出吸附的水分和残留的挥发份。实验获取N2吸附/脱附与CO2吸附曲线,应用BET、BJH、DR模型计算获得比表面积等数据。
2 实验结果
2.1 页岩中各组分吸附穿透曲线特征
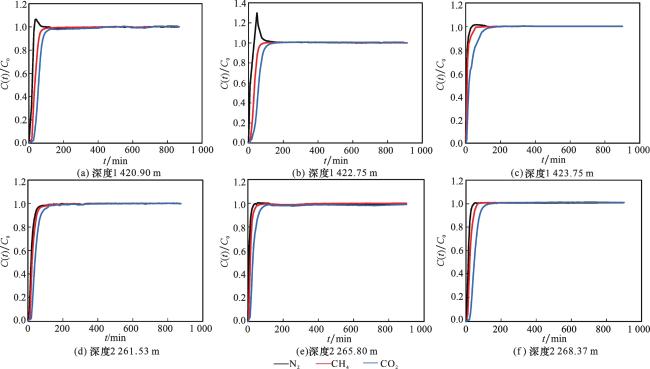
图4(a)为1 420.90 m深度岩样,N2在31 min超过初始浓度,在42 min达到最大值。图4(b)是深度1 422.75 m岩样的穿透曲线图,N2浓度在初始阶段迅速增加,在16 min超过初始浓度,在22 min就达到最大值。图4(c)岩样深度为1 423.75 m,N2的C(t)/C 0值在38 min超过1,在62 min达到最大值,最大值仅为1.014,相比于前2个岩样,N2超过初始浓度的值很小,并且出口端CO2在233 min才增至初始浓度。这3个龙马溪组页岩的穿透曲线图具有相似的趋势,N2、CH4与CO2的穿透曲线都在吸附阶段一开始就迅速上升,并且三者N2的曲线皆有C(t)/C 0值超过1的“团块”状现象。
2.2 低温N2与CO2吸附
表1 岩样氮吸附实验测试结果Table 1 Test results of samples N2 adsorption experiment |
| 深度/m | 比表面积 /(m2/g) | 孔容 /(mL/g) | 平均孔直径 /nm | 最可几孔径 /nm |
|---|---|---|---|---|
| 1 420.90 | 9.809 | 0.015 | 6.211 | 0.755 |
| 1 422.75 | 13.128 | 0.015 | 4.515 | 0.786 |
| 1 423.75 | 9.030 | 0.018 | 8.144 | 0.755 |
| 2 261.53 | 5.743 | 0.013 | 8.720 | 0.756 |
| 2 265.80 | 8.566 | 0.018 | 8.341 | 0.759 |
| 2 268.37 | 11.191 | 0.017 | 5.969 | 0.752 |
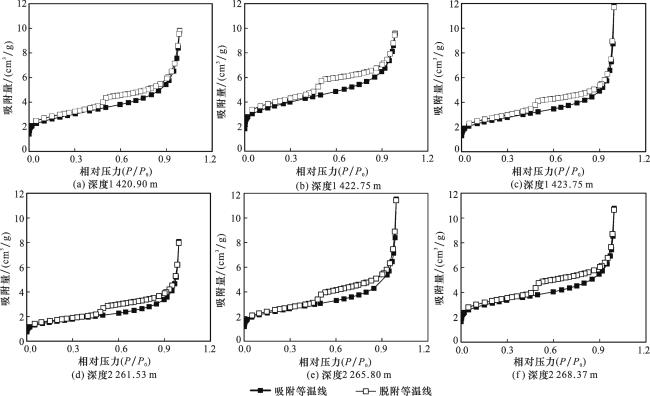
N2吸附等温线代表压力与样品吸附能力的关系,通过BET、BJH模型计算样品比表面积和孔径分布。IUPAC(国际理论和应用化学联合会)研究后将滞后环分为H1—H4共4种类型[32],结果表明,6组岩样的滞后环显示出H2和H4的混合吸附滞后,脱附曲线具备明显拐点,但滞后环十分狭小。岩样的等温吸附/脱附曲线和滞后特征表明,页岩基质表面可以发生单层吸附,且岩样的孔隙结构较为复杂,H2型滞后环反映的孔结构包括典型的“墨水瓶”型孔及孔径分布不均的管形孔等,而H4型滞后环反映的孔结构不规整,包括平板狭缝孔等微孔。
表2 岩样二氧化碳吸附实验测试结果Table 2 Test results of samples CO2 adsorption experiment |
| 深度/m | DR比表面积/(m2/g) | 孔容/(mL/g) | 平均孔直径/nm |
|---|---|---|---|
| 1 420.90 | 7.197 | 0.003 | 2.838 |
| 1 422.75 | 9.872 | 0.004 | 2.875 |
| 1 423.75 | 7.933 | 0.003 | 2.868 |
| 2 261.53 | 4.430 | 0.002 | 2.864 |
| 2 265.80 | 5.704 | 0.002 | 2.865 |
| 2 268.37 | 7.728 | 0.003 | 2.909 |
3 分析与讨论
3.1 数学模型拟合
描述固定吸附床的穿透过程常用的拟合模型有Adams-Bohart、Thomas和Yoon-Nelson模型等,其中Yoon-Nelson模型是基于活性炭对气体的吸附而建立的,它的优点在于形式相对简单,且无需考虑吸附剂的种类和吸附质性质,故选用Yoon-Nelson模型来描述本文研究中的吸附穿透过程。单组分的Yoon-Nelson模型表达式如式(4) :
式中:C为t时刻出口端气体组分浓度;C 0为该组分平衡浓度(初始浓度);k为吸附速率常数,单位为min-1;τ为该组分气体出口浓度达到初始浓度50%的时间;t是取样时间。在本文实验中,通过气相色谱可得到不同时间下每个组分的浓度。拟合出Ln[C /(C 0—C)]与采样时间t的线性关系,可以得到直线的斜率为k,截距与斜率之比为τ。
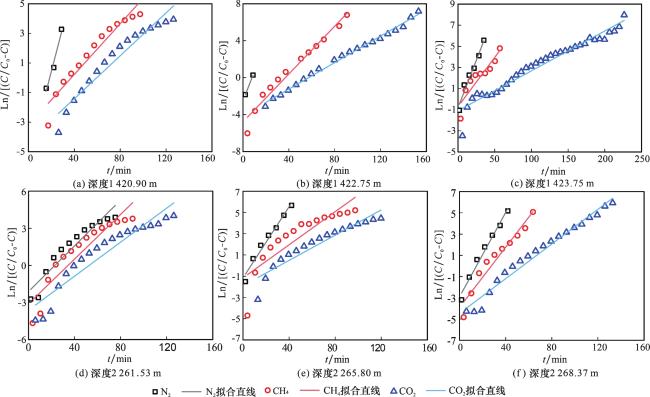
图6 龙马溪组页岩[(a)—(c)]与牛蹄塘组页岩[(d)—(f)]Yoon-Nelson模型拟合结果Fig.6 Yoon-Nelson model fitting results of Longmaxi Formation shale ((a)-(c)) and Niutitang Formation shale((d)-(f)) |
表3 岩样Yoon-Nelson模型拟合参数Table 3 Fitting parameters of Yoon-Nelson model of rock samples |
| 深度/m | 组分 | k/min-1 | τ/min | R 2 | 深度/m | 组分 | k/min-1 | τ/min | R 2 |
|---|---|---|---|---|---|---|---|---|---|
| 1 420.90 | N2 | 0.299 | 18.56 | 0.971 | 2 261.53 | N2 | 0.092 | 22.96 | 0.908 |
| CH4 | 0.086 | 37.44 | 0.932 | CH4 | 0.091 | 34.44 | 0.856 | ||
| CO2 | 0.073 | 59.53 | 0.940 | CO2 | 0.069 | 52.77 | 0.891 | ||
| 1 422.75 | N2 | 0.319 | 7.94 | 1.000 | 2 265.80 | N2 | 0.168 | 6.95 | 0.972 |
| CH4 | 0.129 | 37.01 | 0.968 | CH4 | 0.078 | 14.91 | 0.758 | ||
| CO2 | 0.072 | 57.32 | 0.993 | CO2 | 0.059 | 31.83 | 0.893 | ||
| 1 423.75 | N2 | 0.181 | 4.57 | 0.964 | 2 268.37 | N2 | 0.199 | 14.66 | 0.981 |
| CH4 | 0.093 | 7.59 | 0.839 | CH4 | 0.141 | 27.57 | 0.940 | ||
| CO2 | 0.038 | 29.01 | 0.948 | CO2 | 0.082 | 54.68 | 0.973 |
由表3可知,线性相关系数R 2值大多在0.9以上,说明实验结果与Yoon-Nelson模型拟合较好,该模型可以模拟各岩样对混合气体竞争吸附的过程。
Yoon-Nelson模型中吸附速率常数k通常代表相应组分的传质速率,由拟合结果可知,各岩样吸附混合气体时吸附速率常数k皆有N2>CH4>CO2的规律(表3),表明对于相同浓度的3种气体,N2的传质速率最快,CH4次之,CO2的传质速率最慢。
3.2 高—过成熟页岩混合气体竞争吸附特征与机理
3.2.1 竞争吸附过程及其差异
岩样穿透曲线出口浓度超过初始浓度的“团块”现象可反映竞争吸附过程。N2在深度1 420.90 m、 1 422.75 m、1 423.75 m的穿透曲线中均出现明显“团块”,表明在吸附过程中,出口排出的混合气体中N2浓度超过了初始浓度,而2 261.53 m、2 265.80 m、2 268.37 m深度的穿透曲线从未出现“团块”。
研究表明[14],煤对CO2吸附饱和量约为CH4的2倍,N2的4倍;Langmuir常数b反映的CO2吸附亲和力约为CH4的3倍,N2的5倍,煤和页岩都是孔隙结构复杂的无机矿物质,对于N2、CH4和CO2的吸附选择性类似。由拟合结果可知,在通入混合气后,传质速率最快的N2先被岩样吸附至饱和,接着是CH4,最后CO2才开始被吸附,由于页岩对CO2和CH4的吸附选择性更强且吸附量更大,进而会置换出已被吸附的N2。在吸附过程中,对于1 420.90 m、1 422.75 m、1 423.75 m 3个深度的龙马溪组页岩,N2的穿透曲线出现了出口浓度大于初始浓度的“团块”,表明N2与CH4和CO2发生了竞争吸附,吸附量更大的CH4和CO2将原本吸附的N2置换出孔隙外,导致其出口浓度超过初始浓度。而在2 261.53 m、2 265.80 m、2 268.37 m 3个深度岩样的穿透曲线中,N2出口浓度并未超过初始浓度,表明牛蹄塘组页岩中并未发生竞争吸附。另外在所有样品的实验中,CH4与CO2之间均没有明显的竞争吸附行为。
综上所述,将龙马溪组页岩中发生的竞争吸附过程分为2个阶段:①N2向孔内移动并吸附:一般来说,N2比CH4和CO2具有更高的吸附速率,可先被样品吸附;②被吸附的N2被CH4和CO2置换并解吸:吸附速率更快的N2率先吸附平衡,随后吸附速率慢的CH4和CO2被吸附,但二者吸附量更大且样品对二者吸附选择性更强,故会将N2置换出,导致其出口处浓度超过初始浓度。
3.2.2 竞争吸附机理分析
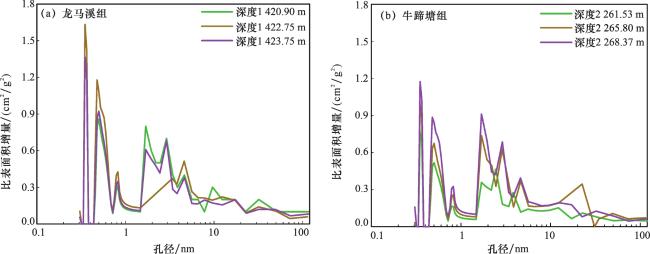
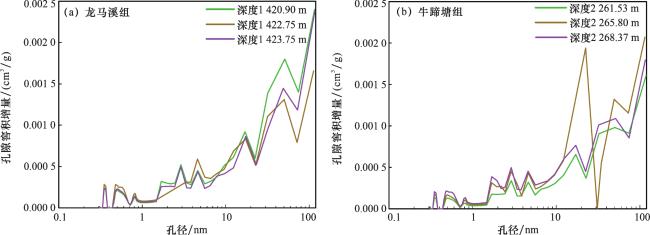
可以看出,龙马溪组和牛蹄塘组的页岩比表面积都是微孔占据着主导,介孔次之,大孔所占比例很小,其中龙马溪组的微孔比表面积增量比牛蹄塘组要更大,而6个深度岩样的孔隙容积增量规律则较为相似,皆呈现出大孔最高,介孔次之,微孔最小的规律。为定量表征岩样内孔隙比表面积和孔隙容积分布特征,计算了岩样微孔、介孔和大孔的比表面积和孔隙容积数值(表4)。
表4 岩样微孔、介孔和大孔的比表面积和孔隙容积Table 4 Specific surface area and pore volume of micropores, mesopores and macropores in rock samples |
| 深度/m | 比表面积/(m2/g) | 孔隙容积/(cm3/g) | ||||||
|---|---|---|---|---|---|---|---|---|
| 总和 | 微孔 | 介孔 | 大孔 | 总和 | 微孔 | 介孔 | 大孔 | |
| 1 420.90 | 16.361 8 | 11.729 0 | 4.441 2 | 0.191 6 | 0.016 5 | 0.003 7 | 0.009 0 | 0.003 8 |
| 1 422.75 | 19.513 3 | 15.233 6 | 4.177 2 | 0.102 5 | 0.010 5 | 0.002 3 | 0.005 7 | 0.002 5 |
| 1 423.75 | 16.468 1 | 12.447 1 | 3.873 6 | 0.147 4 | 0.015 0 | 0.003 9 | 0.007 5 | 0.003 6 |
| 2 261.53 | 9.853 7 | 6.985 5 | 2.764 4 | 0.103 8 | 0.010 3 | 0.002 2 | 0.005 6 | 0.002 5 |
| 2 265.80 | 13.266 9 | 9.361 2 | 3.769 6 | 0.136 1 | 0.013 7 | 0.003 1 | 0.007 4 | 0.003 2 |
| 2 268.37 | 16.201 0 | 12.230 9 | 3.861 8 | 0.108 3 | 0.013 8 | 0.003 9 | 0.007 2 | 0.002 7 |
由分析结果可得,龙马溪组页岩中微孔的比表面积范围为11.729 0~15.233 6 m2/g,平均值为13.136 6 m2/g,牛蹄塘组页岩中微孔的比表面积范围为6.985 5~12.230 9 m2/g,平均值为9.525 9 m2/g,龙马溪组页岩微孔的比表面积总体上大于牛蹄塘组,且中孔也具备相似的特征。在不同孔隙内,气体分子的扩散具有不同形式,在大孔中简单的扩散渗流、孔隙更小的时候的吸附,微孔的比表面积较过渡孔、中孔和大孔高1~2个数量级,是页岩中N2、CH4和CO2的主要赋存场所,其发育程度本质上决定了不同页岩吸附能力的差异。在气体分子流动经过孔隙时,微孔发育的岩样吸附能力强,能更好地吸附CH4和CO2这2种吸附选择性强的气体,从而使得已经吸附的N2被置换出。
3.3 页岩混合气体竞争吸附的地质意义
不同气体在页岩中的吸附特征和煤类似[34-35],气体在页岩内表面的吸附是物理吸附,其本质是页岩表面分子和气体分子之间相互吸引的结果,整个过程是一个渗流—扩散、吸附—脱附的综合过程。混合气体由于各组分吸附能力不同,吸附过程中存在吸附位的竞争[36],而吸附介质中的孔隙提供了大量的吸附位,因此页岩的孔隙结构可能是影响竞争吸附的重要原因之一。前人研究表明,页岩储层矿物组分和孔隙结构与页岩含气性密切相关[37-38]。我国南方地区牛蹄塘组和龙马溪组页岩一直是我国页岩气勘探开发的重点层系,由于热演化程度、沉积环境、矿物组分及有机质含量等因素的影响,牛蹄塘组页岩的平均总孔体积略大于龙马溪组页岩,从微孔、介孔和大孔来看,牛蹄塘组页岩微孔的比表面积、平均孔体积及其占比均大于龙马溪组[39-41]。而本文研究所采集样品位于川北复杂构造带,其龙马溪组与牛蹄塘组页岩的沉积相与四川盆地内存在明显差异,从而导致本文研究中所选择页岩样品中龙马溪组具有微孔更为发育的特征。
作为我国页岩气勘探开发的重点层位,四川盆地及其边缘页岩成熟度普遍偏高,且孔隙演化较为复杂[42],在高过成熟阶段会伴随着N2的大量生成[43]。研究发现,部分地区牛蹄塘组页岩气中N2含量很高,黔北坳陷下寒武统牛蹄塘组页岩气N2含量最高达95%以上,两湖盆地牛蹄塘组N2含量最高达96.52%,渝东南地区则是典型的页岩气富氮区,其部分牛蹄塘组页岩气含量可达90%以上[44-46]。这些富氮页岩气中N2主要来自大气,循环型地热系统造成地表水携带大气沿断裂带下渗,对页岩气储层产生冲洗,导致大气与页岩气发生组分交换,导致页岩气中逐渐富集N2,另外有机质热演化、岩层底板封盖能力差以及流体活动频繁都是造成页岩气富集N2的原因。
高成熟度页岩中气体组分不断变化,页岩孔隙构成也存在差异,这些都会对页岩中混合气体组分间竞争吸附产生影响[47]。通过本文实验研究,表明了CH4、CO2与N2在页岩中吸附存在明显的竞争吸附行为,已经吸附的N2会被置换出来,同时CH4与CO2之间却没有明显的竞争吸附关系。本文实验中龙马溪组页岩的微孔较牛蹄塘组更为发育,使得在竞争吸附过程中,N2被CH4和CO2置换出来,出口端检测到的混合气体N2浓度超过初始浓度。而前文提出部分牛蹄塘组岩层会产出富氮页岩气[44-46],且研究表明牛蹄塘组页岩微孔较发育[39-41],根据本文实验结论,气体在微孔发育的页岩中存在竞争吸附行为,页岩气中石油裂解产生的CH4以及有机质裂解、氧化产生的CO2会将处于吸附态的N2置换出孔隙转变为游离态,造成游离气中N2浓度增加。因此可推测CH4、CO2与N2之间的竞争吸附行为也可能是一些牛蹄塘组页岩气富集N2的重要原因之一。综上所述,本文实验研究为页岩气勘探与开采以及页岩气富氮的原因提供了一定理论依据。
4 结论
(1)三组分混合气体在龙马溪组页岩与牛蹄塘组页岩上具有不同的竞争吸附行为,其中龙马溪组中N2与CH4/CO2发生了明显的竞争吸附,而该现象在牛蹄塘组页岩中并未捕捉到。同时,龙马溪组页岩的BET和DR比表面积均大于牛蹄塘组页岩,另外龙马溪组页岩微孔的比表面积总体大于牛蹄塘组,说明龙马溪页岩微孔更为发育。页岩孔隙发育特征可能是多组分竞争吸附发生的主控因素之一。
(2)页岩样品的穿透曲线实验结果与Yoon-Nelson模型拟合良好,R 2值大于0.9,吸附速率常数k有N2>CH4>CO2的规律,对于等比例的3种气体,N2吸附速率最快,CH4次之,CO2最慢;可将竞争吸附过程分为2个阶段:首先吸附速率更快的N2先被样品吸附;接着吸附选择性更强的CH4和CO2后被吸附,从而将N2置换出孔隙。
(3)我国南方部分地区牛蹄塘组页岩气中具有富氮的特征,研究发现该地区牛蹄塘组页岩微孔平均比表面积、平均孔体积略大于龙马溪组页岩。根据本文实验结论,正由于微孔发育,其页岩气中的CH4、CO2与N2间存在竞争吸附行为,吸附态的N2会被CH4与CO2置换出孔隙,造成游离态N2浓度增加,这也可能是部分牛蹄塘组页岩气富集N2的重要原因之一。
 甘公网安备 62010202000678号