


0 引言
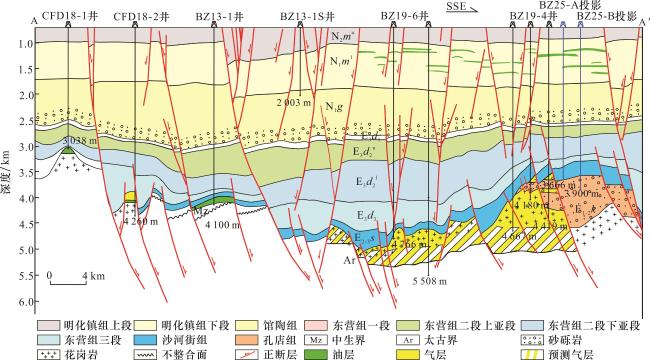
1 地质背景
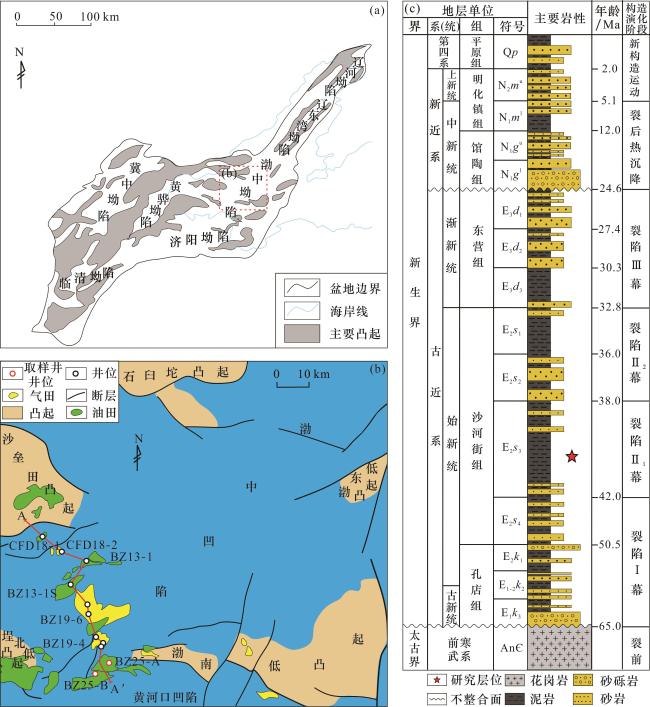
图1 渤海湾盆地地理位置(a)与渤中凹陷主要构造单元及部分油气田分布(b)及地层综合柱状图(c)[(a)和(b)底图据文献[24]修改]Fig.1 Geographical location of Bohai Bay Basin(a) and distribution of main tectonic units and some oil and gas fields(b) and comprehensive stratigraphic histogram(c) of Bozhong Sag [(a) and (b) base maps are modified according to ref.[24]] |
2 样品与方法
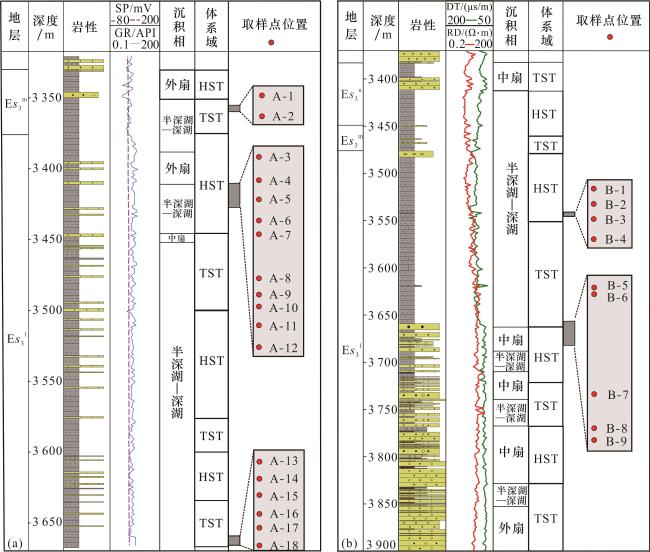
2.1 有机碳含量测定
2.2 主微量元素测定
3 地球化学特征
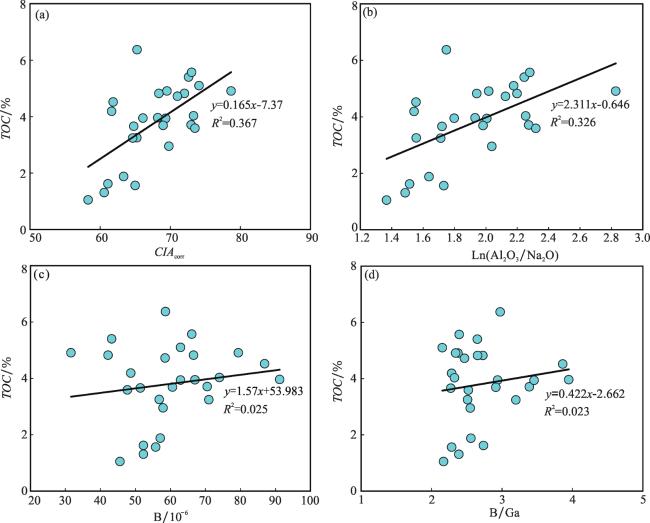
3.1 有机碳含量
表1 Es 3 m—l泥岩TOC和主量元素含量(FeT表示全铁)Table 1 TOC content and major element content of mudstone in Es 3 m—l (FeT represents total iron) |
| 样品编号 | 深度/m | TOC/% | 主量元素/% | |||||||||||
|---|---|---|---|---|---|---|---|---|---|---|---|---|---|---|
| SiO2 | Al2O3 | FeT | MgO | CaO | Na2O | K2O | MnO | TiO2 | P2O5 | 烧失量 | FeO | |||
| A-1 | 3 356.05 | 3.71 | 47.90 | 15.02 | 7.39 | 2.88 | 5.72 | 0.94 | 2.67 | 0.08 | 0.64 | 0.19 | 16.54 | 4.31 |
| A-2 | 3 359.20 | 3.94 | 57.00 | 14.19 | 7.02 | 1.51 | 2.35 | 1.16 | 2.27 | 0.12 | 0.59 | 0.39 | 13.27 | 3.27 |
| A-3 | 3 412.60 | 6.37 | 50.78 | 13.99 | 4.35 | 1.55 | 6.63 | 1.48 | 2.58 | 0.17 | 0.64 | 0.29 | 17.41 | 1.96 |
| A-4 | 3 414.00 | 3.95 | 56.10 | 16.20 | 5.31 | 1.50 | 2.61 | 1.63 | 3.09 | 0.17 | 0.74 | 0.19 | 12.33 | 3.13 |
| A-5 | 3 415.20 | 3.96 | 50.77 | 15.66 | 8.23 | 1.99 | 3.12 | 1.38 | 2.98 | 0.22 | 0.73 | 0.26 | 14.64 | 4.47 |
| A-6 | 3 416.40 | 4.52 | 56.30 | 15.97 | 4.21 | 1.66 | 3.53 | 2.05 | 3.13 | 0.13 | 0.77 | 0.23 | 11.95 | 2.73 |
| A-7 | 3 417.30 | 3.25 | 59.62 | 16.31 | 3.88 | 1.34 | 1.55 | 2.09 | 3.18 | 0.25 | 0.73 | 0.24 | 10.33 | 2.64 |
| A-8 | 3 419.90 | 3.24 | 57.10 | 15.86 | 4.00 | 1.73 | 3.68 | 1.74 | 3.07 | 0.10 | 0.73 | 0.20 | 11.46 | 2.70 |
| A-9 | 3 420.90 | 3.69 | 49.99 | 15.40 | 8.60 | 1.73 | 3.54 | 1.29 | 2.97 | 0.26 | 0.70 | 0.26 | 15.25 | 5.73 |
| A-10 | 3 421.60 | 2.95 | 50.95 | 15.66 | 5.42 | 2.67 | 4.26 | 1.24 | 2.83 | 0.11 | 0.70 | 0.19 | 15.92 | 3.85 |
| A-11 | 3 422.75 | 3.66 | 53.53 | 15.26 | 6.33 | 1.59 | 3.64 | 1.66 | 2.96 | 0.22 | 0.72 | 0.24 | 13.72 | 3.89 |
| A-12 | 3 423.99 | 4.82 | 50.42 | 15.37 | 8.56 | 2.07 | 3.31 | 1.34 | 2.96 | 0.38 | 0.75 | 0.25 | 14.58 | 5.52 |
| A-13 | 3 660.20 | 1.05 | 59.60 | 15.30 | 4.23 | 2.04 | 3.88 | 2.37 | 3.30 | 0.04 | 0.78 | 0.35 | 7.98 | 3.05 |
| A-14 | 3 661.20 | 1.31 | 61.63 | 15.34 | 3.51 | 1.54 | 3.62 | 2.11 | 3.42 | 0.03 | 0.68 | 0.25 | 7.76 | 2.37 |
| A-15 | 3 662.20 | 1.56 | 56.63 | 16.55 | 4.36 | 1.88 | 3.68 | 1.78 | 3.79 | 0.03 | 0.82 | 0.30 | 10.05 | 3.33 |
| A-16 | 3 663.25 | 1.62 | 55.07 | 14.66 | 5.18 | 1.73 | 6.18 | 1.96 | 3.25 | 0.04 | 0.69 | 0.36 | 10.84 | 4.14 |
| A-17 | 3 664.10 | 1.88 | 58.55 | 16.08 | 4.09 | 1.82 | 3.73 | 1.90 | 3.57 | 0.03 | 0.77 | 0.26 | 9.13 | 3.17 |
| A-18 | 3 665.20 | 4.19 | 57.21 | 14.93 | 4.42 | 1.81 | 4.95 | 1.94 | 3.25 | 0.03 | 0.70 | 0.27 | 10.43 | 3.82 |
| B-1 | 3 543.80 | 5.40 | 43.37 | 11.63 | 3.37 | 2.14 | 13.48 | 0.75 | 1.88 | 0.10 | 0.51 | 0.35 | 22.35 | 2.04 |
| B-2 | 3 544.75 | 3.59 | 52.33 | 13.21 | 4.42 | 1.50 | 7.73 | 0.79 | 2.10 | 0.24 | 0.55 | 0.16 | 16.96 | 2.11 |
| B-3 | 3 545.73 | 4.82 | 47.75 | 11.51 | 4.19 | 1.99 | 11.30 | 0.78 | 1.76 | 0.16 | 0.47 | 0.16 | 19.86 | 2.14 |
| B-4 | 3 547.00 | 4.91 | 48.04 | 9.45 | 4.42 | 1.86 | 12.76 | 0.76 | 1.41 | 0.17 | 0.40 | 0.16 | 20.50 | 2.15 |
| B-5 | 3 659.77 | 4.72 | 52.82 | 16.26 | 6.93 | 1.32 | 1.58 | 1.18 | 3.53 | 0.11 | 0.66 | 0.15 | 15.42 | 4.10 |
| B-6 | 3 660.60 | 4.91 | 46.88 | 19.80 | 7.49 | 1.54 | 1.53 | 0.71 | 4.23 | 0.08 | 0.95 | 0.19 | 16.56 | 3.39 |
| B-7 | 3 677.50 | 4.03 | 54.12 | 19.58 | 5.29 | 1.22 | 1.25 | 1.25 | 4.49 | 0.04 | 0.91 | 0.17 | 11.65 | 2.49 |
| B-8 | 3 682.00 | 5.10 | 51.87 | 18.58 | 7.30 | 1.30 | 1.01 | 1.28 | 4.18 | 0.08 | 0.82 | 0.19 | 13.24 | 4.01 |
| B-9 | 3 683.54 | 5.57 | 56.64 | 18.18 | 4.87 | 1.28 | 1.51 | 1.13 | 4.08 | 0.07 | 0.78 | 0.17 | 11.25 | 2.37 |
3.2 主微量元素特征
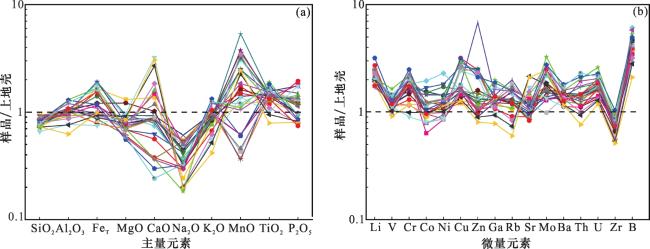
表2 Es 3 m—l泥岩部分微量元素含量及相关参数的计算结果Table 2 The contents of trace elements and the calculatio results of related parameters in mudstone of Es 3 m—l |
| 样品 编号 | 深度 /m | 微量元素/10-6 | 古气候 | 古盐度 | 氧化还原条件 | 沉积速率 | |||||||||||||||
|---|---|---|---|---|---|---|---|---|---|---|---|---|---|---|---|---|---|---|---|---|---|
| Li | V | Ga | Sr | Mo | Ba | Th | U | Zr | CIA corr | Ln(Al2O3 /Na2O) | B | B/Ga | Corg/P | UEF | MoEF | Ti/Al | K/Al | (Zr/Al) /10-4 | LSR /(cm/ka) | ||
| A-1 | 3 356.05 | 47.9 | 121 | 20.8 | 484 | 2.07 | 836 | 12.1 | 3.9 | 118 | 72.97 | 2.27 | 70.5 | 3.39 | 112.2 | 4.53 | 2.19 | 0.048 | 0.28 | 14.85 | 10.9 |
| A-2 | 3 359.20 | 54.2 | 118 | 18.2 | 316 | 2.7 | 618 | 11.9 | 4.56 | 131 | 69.35 | 2.01 | 62.9 | 3.46 | 59.6 | 5.61 | 3.02 | 0.047 | 0.25 | 17.45 | 10.9 |
| A-3 | 3 412.60 | 36.4 | 119 | 19.7 | 518 | 3.37 | 687 | 12.8 | 5.34 | 123 | 65.28 | 1.75 | 58.6 | 2.97 | 130.3 | 6.66 | 3.83 | 0.052 | 0.29 | 16.62 | 13.0 |
| A-4 | 3 414.00 | 40.6 | 128 | 22.8 | 322 | 1.97 | 745 | 15.3 | 5.03 | 143 | 66.11 | 1.80 | 67.0 | 2.94 | 120.7 | 5.42 | 1.93 | 0.051 | 0.30 | 16.69 | 13.0 |
| A-5 | 3 415.20 | 41.2 | 143 | 23.1 | 306 | 4.13 | 823 | 14.7 | 4.9 | 142 | 68.22 | 1.93 | 91.2 | 3.95 | 88.0 | 5.46 | 4.19 | 0.052 | 0.30 | 17.14 | 13.0 |
| A-6 | 3 416.40 | 38.7 | 118 | 22.5 | 362 | 2.64 | 689 | 20.8 | 5.73 | 145 | 61.87 | 1.56 | 86.9 | 3.86 | 116.9 | 6.26 | 2.62 | 0.054 | 0.31 | 17.16 | 13.0 |
| A-7 | 3 417.30 | 40.1 | 121 | 22.6 | 299 | 2.81 | 767 | 15.5 | 5.72 | 150 | 65.23 | 1.56 | 56.8 | 2.51 | 81.2 | 6.12 | 2.74 | 0.051 | 0.31 | 17.39 | 13.0 |
| A-8 | 3 419.90 | 38.7 | 119 | 22.2 | 349 | 2.78 | 756 | 14.7 | 4.52 | 146 | 64.66 | 1.71 | 71.0 | 3.20 | 97.5 | 4.97 | 2.78 | 0.052 | 0.30 | 17.40 | 13.0 |
| A-9 | 3 420.90 | 37.6 | 137 | 20.8 | 335 | 2.25 | 813 | 14.7 | 4.49 | 129 | 68.99 | 1.98 | 60.6 | 2.91 | 82.7 | 5.09 | 2.32 | 0.051 | 0.30 | 15.83 | 9.2 |
| A-10 | 3 421.60 | 48.6 | 125 | 22.7 | 427 | 2.41 | 844 | 12.0 | 3.75 | 125 | 69.81 | 2.04 | 57.9 | 2.55 | 90.7 | 4.18 | 2.44 | 0.050 | 0.28 | 15.09 | 9.2 |
| A-11 | 3 422.75 | 41.1 | 137 | 22.6 | 410 | 2.39 | 801 | 15.3 | 4.95 | 164 | 64.81 | 1.72 | 51.4 | 2.27 | 88.8 | 5.66 | 2.49 | 0.053 | 0.30 | 20.32 | 9.2 |
| A-12 | 3 423.99 | 40.9 | 149 | 24.4 | 350 | 3.39 | 781 | 18.3 | 5.17 | 134 | 68.38 | 1.94 | 66.6 | 2.73 | 114.1 | 5.87 | 3.50 | 0.055 | 0.30 | 16.48 | 9.2 |
| A-13 | 3 660.20 | 48.0 | 105 | 21.0 | 415 | 2.08 | 823 | 15.7 | 4.58 | 146 | 72.61 | 2.24 | 43.2 | 2.65 | 91.1 | 5.24 | 2.74 | 0.049 | 0.25 | 18.04 | 13.4 |
| A-14 | 3 661.20 | 48.7 | 118 | 21.9 | 464 | 2.63 | 830 | 14.1 | 4.43 | 179 | 73.53 | 2.32 | 47.7 | 2.52 | 132.5 | 4.89 | 4.94 | 0.047 | 0.25 | 15.17 | 13.4 |
| A-15 | 3 662.20 | 47.5 | 126 | 24.4 | 399 | 1.98 | 789 | 13.4 | 3.92 | 169 | 72.02 | 2.20 | 42.2 | 2.65 | 172.5 | 5.44 | 3.74 | 0.047 | 0.24 | 16.75 | 13.4 |
| A-16 | 3 663.25 | 42.2 | 115 | 19.1 | 465 | 1.93 | 777 | 12.2 | 3.96 | 149 | 69.53 | 2.02 | 31.6 | 2.38 | 179.0 | 6.13 | 6.18 | 0.047 | 0.23 | 19.46 | 13.4 |
| A-17 | 3 664.10 | 48.7 | 116 | 22.3 | 412 | 1.48 | 745 | 15.0 | 4.73 | 151 | 71.04 | 2.13 | 58.5 | 2.47 | 185.9 | 5.67 | 3.67 | 0.046 | 0.34 | 16.51 | 13.4 |
| A-18 | 3 665.20 | 49.6 | 125 | 21.3 | 433 | 2.40 | 683 | 14.6 | 4.65 | 154 | 78.69 | 2.83 | 79.4 | 2.34 | 152.5 | 6.43 | 3.93 | 0.054 | 0.34 | 16.23 | 13.4 |
| B-1 | 3 543.80 | 40.1 | 120 | 16.3 | 595 | 2.01 | 617 | 10.2 | 3.49 | 111 | 73.32 | 2.25 | 74.0 | 2.33 | 138.3 | 5.66 | 3.34 | 0.053 | 0.36 | 19.02 | 11.2 |
| B-2 | 3 544.75 | 45.8 | 129 | 18.9 | 540 | 4.11 | 729 | 10.7 | 3.7 | 106 | 74.12 | 2.18 | 62.9 | 2.15 | 155.1 | 5.63 | 2.80 | 0.050 | 0.35 | 16.58 | 11.2 |
| B-3 | 3 545.73 | 40.4 | 110 | 15.9 | 753 | 2.71 | 642 | 10.0 | 3.59 | 102 | 73.06 | 2.28 | 66.1 | 2.39 | 196.9 | 5.21 | 3.22 | 0.049 | 0.35 | 14.77 | 11.2 |
| B-4 | 3 547.00 | 36.5 | 97.6 | 13.3 | 736 | 3.68 | 640 | 8.16 | 3.32 | 97.3 | 58.29 | 1.37 | 45.6 | 2.17 | 17.6 | 5.22 | 2.16 | 0.058 | 0.34 | 18.04 | 11.2 |
| B-5 | 3 659.77 | 35.3 | 127 | 23.7 | 292 | 3.76 | 702 | 15.6 | 5.28 | 142 | 60.58 | 1.49 | 52.3 | 2.39 | 30.9 | 5.04 | 2.72 | 0.050 | 0.35 | 22.06 | 11.3 |
| B-6 | 3 660.60 | 41.3 | 176 | 33.9 | 367 | 4.90 | 873 | 21.8 | 7.3 | 170 | 65.00 | 1.73 | 55.8 | 2.29 | 30.5 | 4.13 | 1.90 | 0.056 | 0.36 | 19.30 | 11.3 |
| B-7 | 3 677.50 | 63.6 | 137 | 31.8 | 397 | 4.12 | 992 | 22.8 | 6.35 | 197 | 61.12 | 1.51 | 52.3 | 2.74 | 26.7 | 4.71 | 2.09 | 0.053 | 0.35 | 19.21 | 11.3 |
| B-8 | 3 682.00 | 41.5 | 156 | 29.2 | 373 | 3.28 | 953 | 24.6 | 6.0 | 163 | 63.37 | 1.64 | 57.1 | 2.56 | 42.1 | 5.13 | 1.46 | 0.054 | 0.35 | 17.75 | 11.3 |
| B-9 | 3 683.54 | 33.7 | 136 | 27.6 | 371 | 3.69 | 873 | 18.7 | 5.43 | 142 | 61.65 | 1.54 | 48.7 | 2.29 | 90.7 | 5.43 | 2.55 | 0.053 | 0.34 | 19.50 | 11.3 |
|
4 讨论
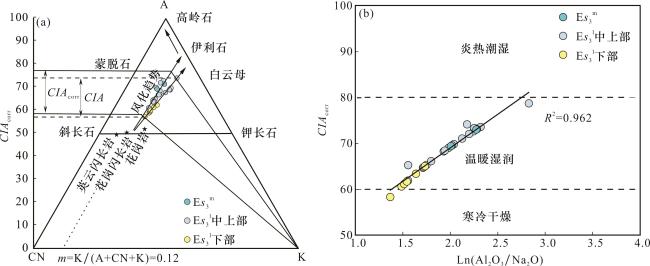
4.1 古气候
4.2 古盐度
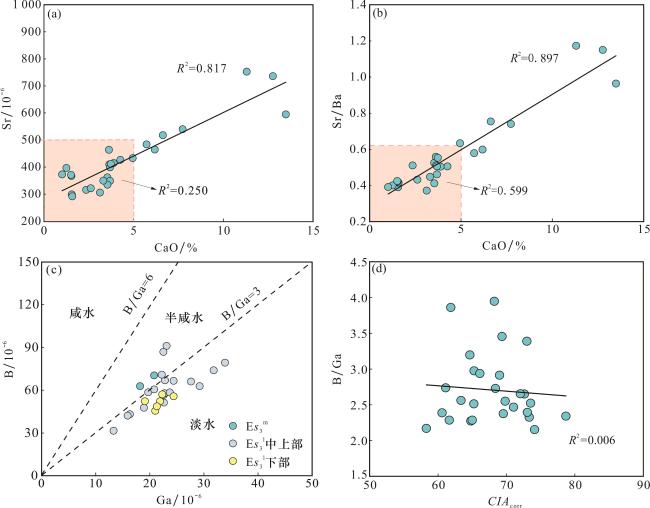
图7 Es 3 m—l泥岩CaO—Sr含量关系(a)与CaO—Sr/Ba关系(b)与B—Ga盐度判别关系(c)与古气候参数CIA corr与古盐度参数B/Ga相关关系(d)Fig.7 Diagram of CaO-Sr content(a) and CaO-Sr/Ba(b) and discriminant diagram between B-Ga content and salinity(c), correlation between the paleoclimate parameters CIA corr and the paleo salinity parameters B/Ga(d) of mudstone in Es 3 m—l |
4.3 古氧化还原条件
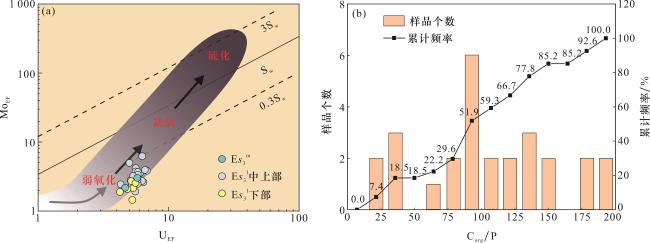
图8 Es 3 m—l泥岩Mo—U协变模式图(a)与Corg/P摩尔比频率分布直方图(b)Fig.8 Covariant pattern diagram of Mo-U(a) and histogram of Corg/P molar ratio frequency distribution(b) of mudstone in Es 3 m—l |
 甘公网安备 62010202000678号