


0 引言
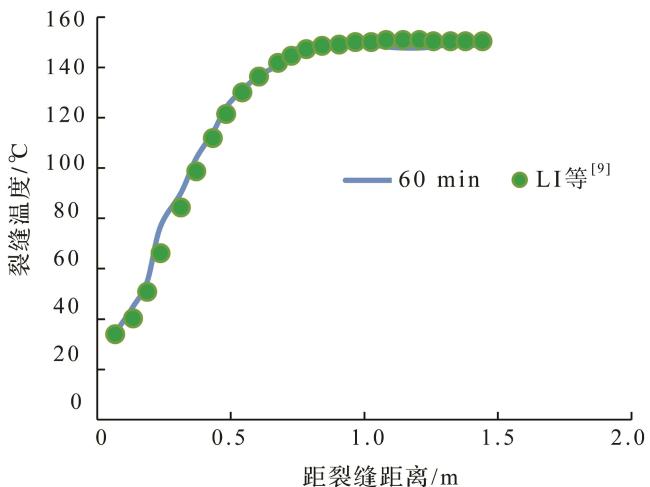
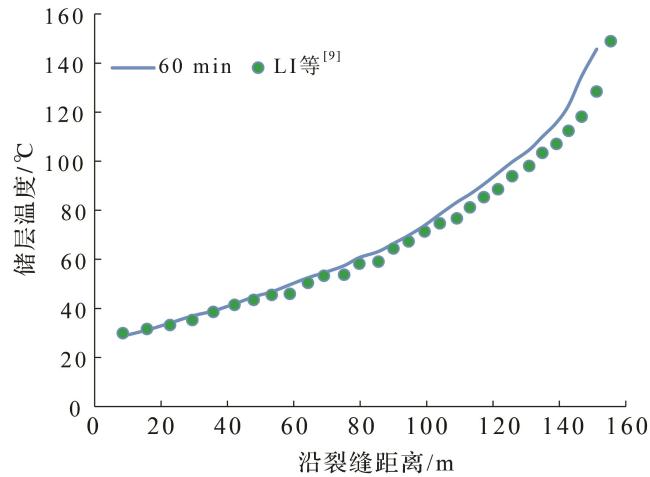
近年来随着光纤测量技术的快速发展,分布式光纤温度测试技术(DTS)逐渐成熟,它可以探测微小的温度变化,实时提供准确而连续的温度数据[1]。基于分布式温度测试(Distributed Temperature Sensors,DTS)、生产测井工具(Production Logging Tool,PLT)等的井下温度测试越来越多地被用于水平井井下状况监测[2],根据测得的井下温度数据,可以定性判断产水位置、识别流体类型、监测套管漏失,并用以诊断人工裂缝、评价压裂改造效果、评价完井效果等。通过建立理论模型,井下温度测试数据还可用于定量解释储层参数、裂缝参数、产出剖面预测等。罗红文等[3-7]建立了考虑微热效应的低渗气藏两相渗流时压裂水平井的耦合预测模型,并且建立了一套模拟低渗气藏压裂水平井生产过程温度剖面的理论模型,通过井筒温度剖面对压裂过程中的各项参数进行敏感性评价,并对生产过程中的温度分布进行了预测。朱世琰[8]建立出一套油水两相温度预测模型,预测出了水平井的温度剖面,并通过所测得的温度剖面数据解释了产出剖面,进而确定了出水位置。LI等[9]提出了非稳态数值油藏模型和稳态井筒模型。YOSHIOKA等[10]建立了两相流稳态井筒/油藏热学模型去探测水平井气/水突破位置。该模型耦合了井筒和油藏模型,计算沿井筒的温度变化,在地层中考虑了微热效应。SUI等[11]研究表明如果时间足够长,井筒模型可由非稳态变为稳态。对于水平井,周围地层温度变化相对较小,水平井井筒温度变化主要受热膨胀、黏性耗散和热传导等微热效应所控制。王鸿勋等[12]给出了井筒非稳态传热数值计算模型,其中主要考虑了井筒积液与井筒、水泥环及地层之间的热交换。
从以上研究中可以看出,在水平井温度分布预测方向上,国内外的学者们做了大量相关的研究和实验,但是在定量预测水平井压裂过程中温度分布方面的研究还存在不足。因此,本文建立了一套水平井分段压裂泵注过程中的温度分布预测模型,考虑了多种微热效应的影响,分别建立了井筒模型、裂缝模型及储层模型,并完成模型耦合求解,采用建立的温度模型分别模拟了一口水平井常规压裂和分段多簇压裂时的温度分布,分析了水平井分段压裂过程中的温度分布特征,以及压裂液排量、地层滤失系数对温度分布的影响规律,对于指导水平井分段压裂和改造效果评价具有重要意义。
1 模型建立
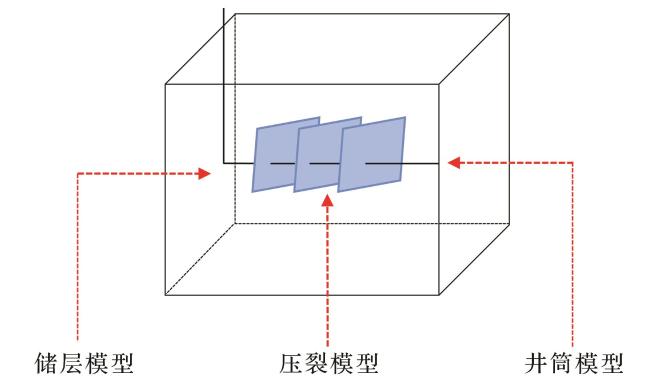
建立的温度预测模型结构如图1所示:
1.1 水平井段井筒模型
在压裂过程中,压裂液流经井筒进入裂缝,这是一个连续换热过程,射孔孔眼处温度就是裂缝入口初始温度,因此井筒温度场是计算裂缝温度场的基础,必须准确预测井底温度随时间的变化规律。
采用单相井筒流动模型及瞬态井筒热模型,为更新储层和裂缝温度提供信息。
1.1.1 水平井井筒流动模型
YOSHIOKA等[10]提出的生产期质量守恒方程为:
式中:t为时间,s;R为井筒内径,m; 为井筒打开程度;ρ l为井筒流入流体密度,kg/m3;v为注入流体在射孔位置流入裂缝的速度,m/s,该速度由井筒流动模型计算,并作为压裂液模型的输入; v l为井筒中注入液速度,m/s;ρ wb为井筒中的流体密度,kg/m3。此外,本文研究的目的是压裂处理,v的方向与生产过程相反。质量平衡方程为:
井筒流动模型的初始和边界条件:
式中: 为射孔位置外压裂进入裂缝的速度,m/s。
1.1.2 水平井井筒热模型
1.2 裂缝模型
1.2.1 裂缝流动模型
为了简单起见,对裂缝几何形态进行如下假设:①发生在裂缝处的流体滤失与裂缝面呈线性垂直;②注入过程中裂缝具有无限的导流能力;③压裂液不可压缩。并对裂缝扩展过程进行了建模[16],裂缝的流动模型为:
式中: 为裂缝延伸长度x的时间之后,流体滤失开始;X f为裂缝半长,m;w、h分别为任意微元段的宽和高,m;C为考虑流体压缩性效应C c、流体黏度效应C v和造壁性效应C w的总流体滤失系数。
初始和边界条件为:
式中: 是注入时间,s;裂缝半长在关井过程中保持恒定。
1.2.2 裂缝热学模型
建立了裂缝热学模型[17],计算了裂缝扩展和关井过程中裂缝内压裂液温度分布。能量守恒的概念与体积微分方程上的裂缝流动模型相似。
h 1被定义为牛顿传热系数,由以下方程计算:
式中:“—”表示注入流体的性质,以便区分储层和井筒模型;N和s为从实验中获得的无量纲经验常数。
上述式(12) 的左端为随时间变化的微分体积能量积累,右端第一项为压裂液流动引起的热对流;第二项为流体损失引起的对流能量损失,最后一项为压裂液与周围环境之间的热传递。
初始和边界条件为:
式中:T i为初始储层温度,℃。
1.3 储层模型
1.3.1 储层流动模型
压裂液从裂缝面向储层滤失的距离可通过将滤失速度与滤失时间相结合来计算。
式中: 为压裂液从裂缝面向储层滤失的距离,m; 为压裂液从裂缝面向储层滤失的速度,m/s;C为考虑流体压缩性效应C c、流体黏度效应C v和造壁性效应C w的总流体滤失系数。
1.3.2 储层热学模型
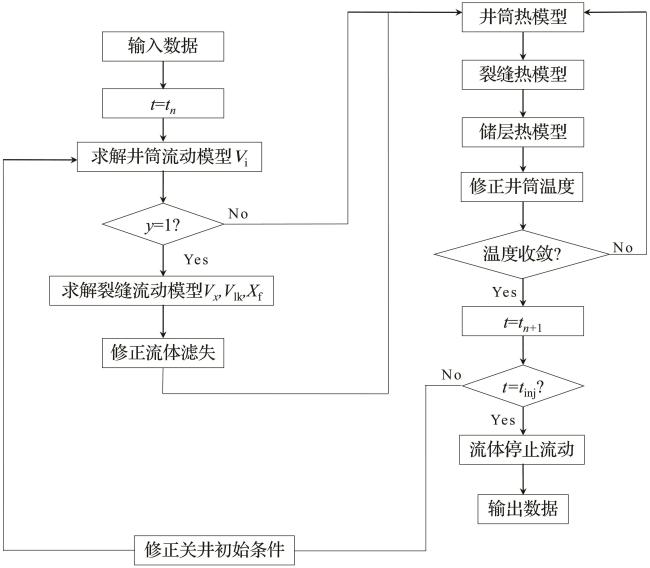
1.4 耦合模型及求解
2 水平井分段压裂温度分布示例分析
通过模拟一口水平井分段压裂过程中的温度动态,分析水平井分段压裂过程中温度分布特征,并分析压裂液排量、地层滤失系数对温度分布的影响规律,计算示例所需的基本参数如表1所示。
表1 模拟计算所需基础参数Table 1 Basic parameters required for simulation calculation |
| 参数名称 | 取值 | 参数名称 | 取值 |
|---|---|---|---|
| 注入时间/s | 3 600 | 总的平均滤失系数/(m/s1/2) | 0.020 5 |
| 注入速率/(m3/s) | 0.023 | 储层岩石导热系数/[J/( m·s·K)] | 1.606 |
| 裂缝宽度/m | 0.006 1 | 储层流体导热系数/[J/( m·s·K)] | 0.681 3 |
| 裂缝高度/m | 45.72 | 压裂液导热系数/[J/( m·s·K)] | 0.931 3 |
| 模拟时间步长/s | 120 | 储层岩石比热容/[J/(kg·K)] | 845.73 |
| 井筒半径/m | 0.22 | 储层流体比热容/[J/(kg·K)] | 4 178.43 |
| 储层初始地层温度/℃ | 150 | 压裂液比热容/[J/(kg·K)] | 4 178.43 |
| 裂缝流体注入温度/℃ | 26.67 | 储层流体密度/(kg/m3) | 420 |
| 储层孔隙度(Φ)/% | 0.045 | 压裂液密度/(kg/m3) | 993.144 |
| 储层岩石密度/(kg/m3) | 2 380 | — | — |
2.1 水平井常规分段压裂
2.1.1 水平井压裂温度分布模拟
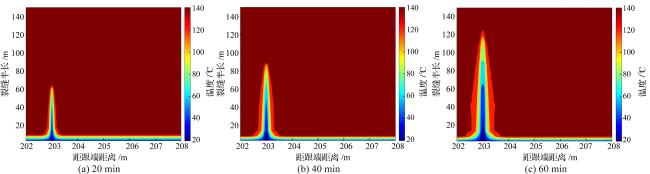
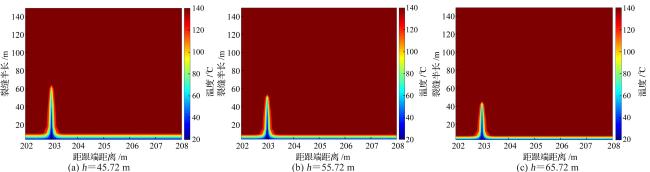
在压裂液注入过程中,注入时间对裂缝延伸及温度分布有重要作用,为此,下面给出了该水平井在压裂进行到20 min、40 min及60 min时温度分布特征。
图5所示为单一裂缝在不同注入时间时整个耦合系统的温度,发现随注入时间不断增大,裂缝不断往前延伸,在储层中形成一个“尖锥”,由64 m扩大到138 m左右时,且裂缝四周的滤失距离也随着时间不断向地层扩展,“尖锥”变得越长越宽。通过温度云图还可以看出,随着注入流体在井筒及裂缝中的流动,当流体流入裂缝时,在裂缝跟端位置,温度变化较小,随着流体更进一步的往裂缝中流动,储层也在不断对裂缝中的流体加热使得裂缝中的流体温度不断升高,直至滤失前缘的流体温度与地层温度保持一致。
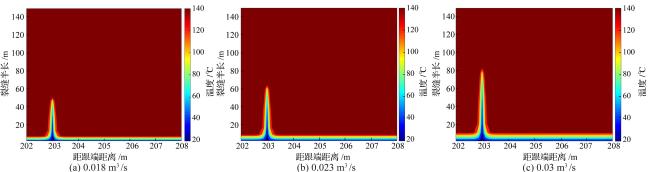
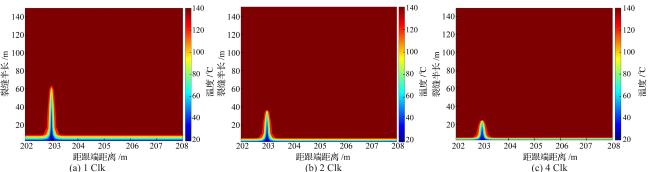
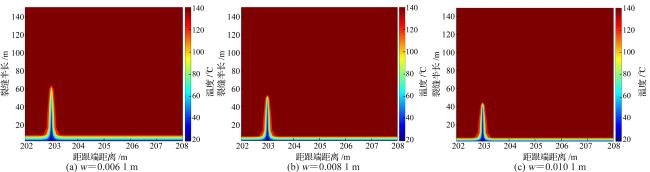
2.1.2 温度分布影响规律分析
2.2 水平井分段多簇压裂
2.2.1 水平井温度分布模拟
2.2.2 温度分布影响规律分析
下面对分段多簇压裂时的温度分布进行研究,假设单段注入流量为0.064 m3/s。段内分4簇,各簇注入量及其裂缝参数如表3所示。
表3 各射孔簇注入流量与裂缝半长Table 3 Injection flow rate and fracture half-length of each perforation cluster |
| 簇号 | 注入速率/(m3/s) | 裂缝半长/m |
|---|---|---|
| 1 | 0.015 | 42.06 |
| 2 | 0.015 | 42.06 |
| 3 | 0.017 | 48.93 |
| 4 | 0.017 | 48.93 |
|
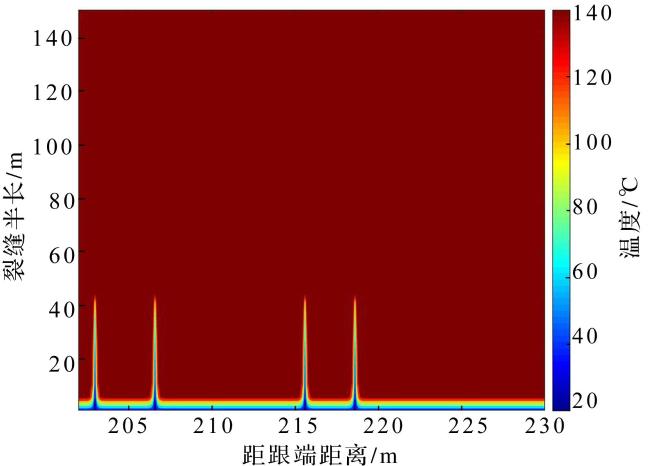
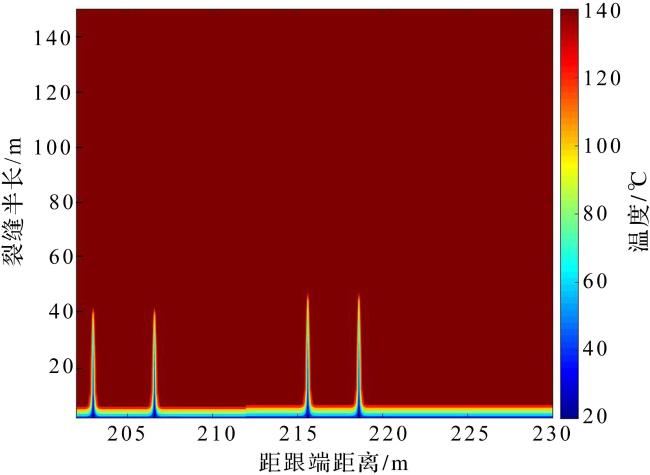
图11 4条裂缝注入量相等水平井温度分布特征(0.016 m3/s)Fig. 11 Temperature distribution cloud map of horizontal well with the same injection amount of four fractures (0.016 m3/s) |
3 结论
(1)本文在考虑多种微量热效应的基础之上,建立了一套水平井分段压裂注液过程中的温度分布预测模型,并完了耦合求解,实现了水平井分段压裂注液过程中的温度分布动态模拟预测。
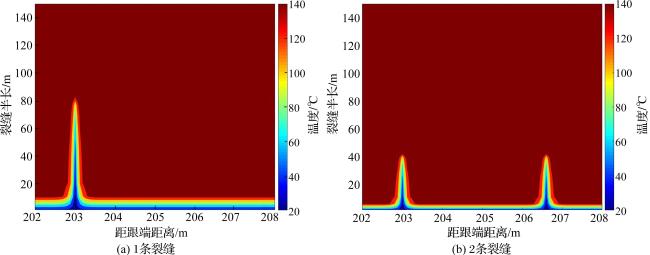
(2)采用建立的温度模型模拟分析了水平井常规分段压裂和分段多簇压裂注液过程中的温度动态,结果表明,在水平井水力压裂注入过程中,在裂缝起裂位置,储层温度分布会形成一个“尖锥”,且裂缝四周的滤失距离也随着时间不断向地层扩展,导致“尖锥”变得越长越宽。
(3)水平井压裂段内形成单裂缝时,比段内形成多条裂缝时的温度响应更明显;段内多簇起裂时,储层温度分布上都会形成多个“尖锥”,而每一个“尖锥”就对着一条张开裂缝,据此特征可对压裂段内形成的裂缝数量和位置进行准确诊断。
(4)随着压裂液注入时间的不断增长,井筒温度剖面在起裂位置的温降也越大,为了定量描述裂缝半长与温降的联系,可以通过DTS测量压裂注液过程中动态温度数据,从而进行裂缝诊断,如裂缝位置识别、裂缝半长大小。
 甘公网安备 62010202000678号