


0 引言
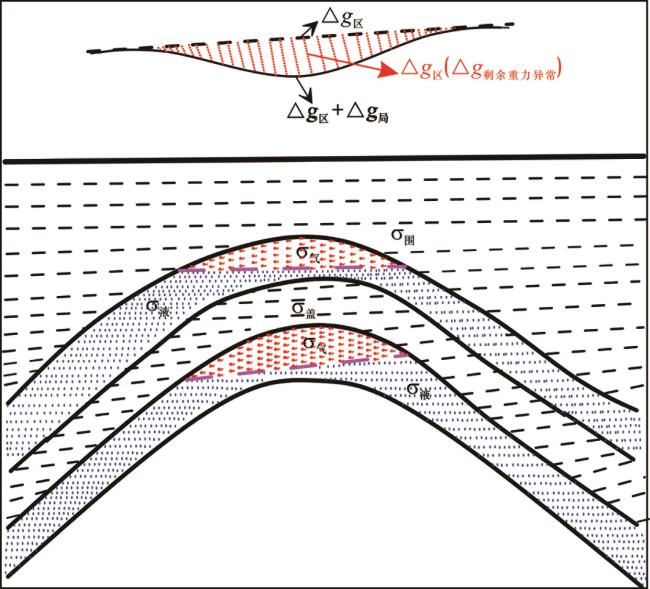
1 含气地层在重力异常剖面上的特征
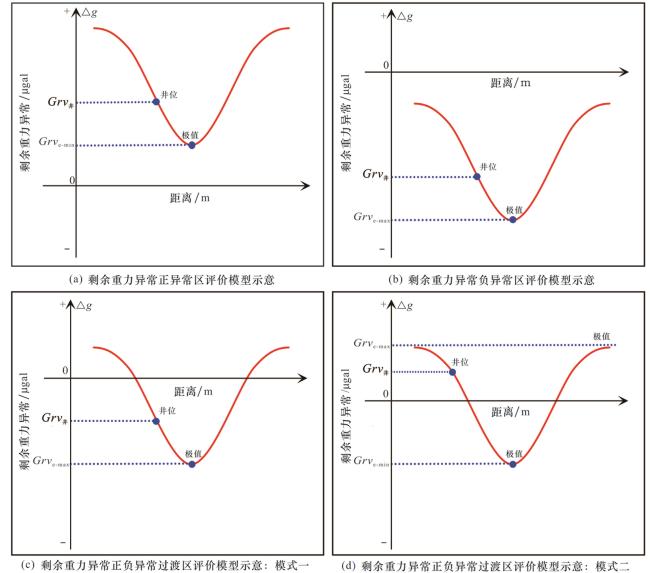
2 微重力监测剩余气开发潜力及开发井评价模型建立
3 微重力监测成果在Su14加密井区应用
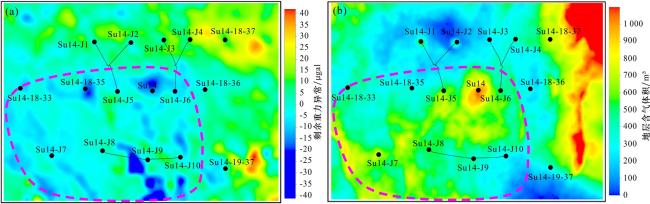
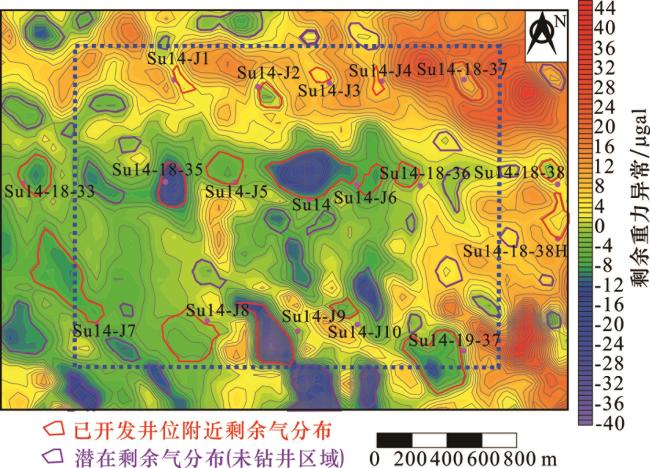
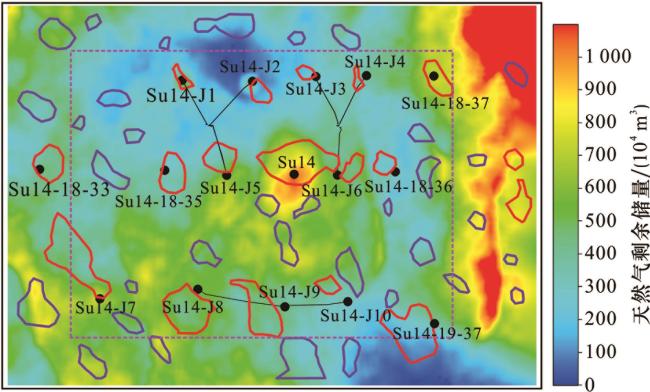
3.1 微重力监测结果描述Su14加密井区剩余气分布及评价剩余气开发潜力
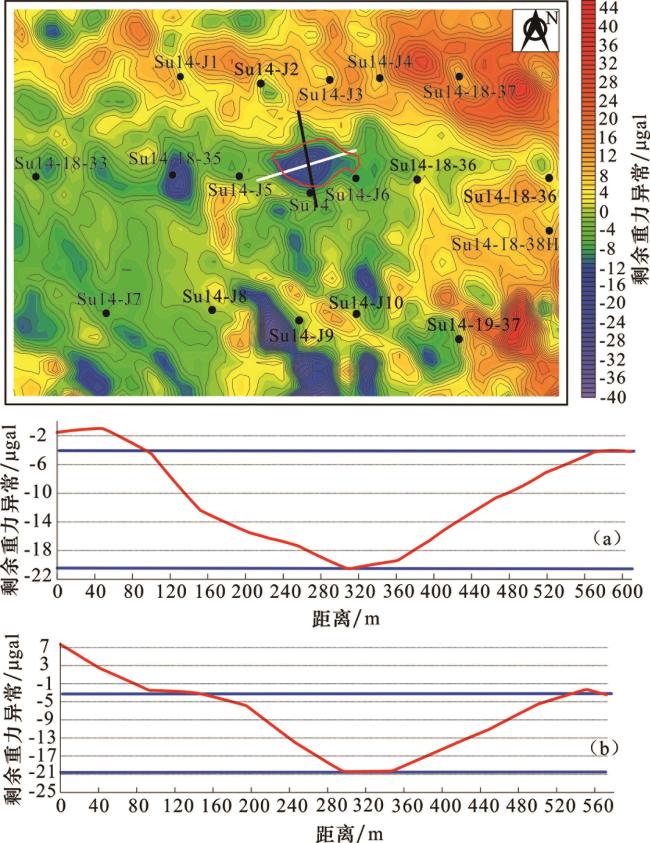
3.2 开发井位评价及井位附近区域剩余气开发潜力评价
表1 Su14区块微重力监测正异常区各开发井统计Table 1 Statistics of development wells in the positive anomaly area of microgravity monitoring in block Su14 |
| 井号 | Grv 井/μgal | Grv e-min/μgal | 评价因子/10-2 | 累计产量/(104 m3) | 动储量/(104 m3) | 采出程度/% |
|---|---|---|---|---|---|---|
| Su14-J4 | 8.950 | 6.550 | 72.326 | 1 452 | 2 050 | 70.83 |
| Su14-J1 | 4.099 | 2.050 | 50.017 | 1 780 | 2 430 | 73.26 |
| Su14-J3 | 7.146 | 4.850 | 67.867 | 1 213 | 1 798 | 67.46 |
| Su14-18-37 | 10.603 | 10.150 | 95.728 | 3 926 | 4 695 | 83.62 |
表2 Su14区块微重力监测负异常区各开发井统计Table 2 Statistics of development wells in the negative anomaly area of microgravity monitoring in block Su 14 |
| 井号 | Grv 井/μgal | Grv e-max/μgal | 评价因子/10-2 | 累计产量/(104 m3) | 动储量/(104 m3) | 采出程度/% |
|---|---|---|---|---|---|---|
| Su14 | -6.527 | -20.250 | 32.232 | 2 532 | 4 635 | 54.63 |
| Su14-18-33 | -5.094 | -10.000 | 50.937 | 1 911 | 2 841 | 67.26 |
| Su14-18-35 | -15.264 | -19.550 | 62.121 | 1 330 | 1 858 | 71.56 |
| Su14-J7 | -5.872 | -12.750 | 62.715 | 3 655 | 4 673 | 78.21 |
| Su14-J6 | -7.463 | -8.650 | 86.277 | 1 643 | 2 258 | 72.76 |
表3 模式一:Su14区块微重力监测区正负异常过渡区各开发井统计Table 3 Model one: Statistics of development wells in the positive and negative anomaly transition area of microgravity monitoring in block Su14 |
| 井号 | Grv 井/μgal | Grv e-min/μgal | 评价因子/10-2 | 累计产量/(104 m3) | 动储量/(104 m3) | 采出程度/% |
|---|---|---|---|---|---|---|
| Su14-J9 | -1.039 | -37.950 | 2.738 | 1 559 | 2 261 | 68.97 |
| Su14-19-37 | -0.459 | -12.050 | 3.809 | 2 983 | 4 420 | 67.49 |
| Su14-J8 | -0.203 | -1.625 | 12.507 | 1 329 | 1 725 | 77.04 |
| Su14-J5 | -3.890 | -6.413 | 60.654 | 2 494 | 3 182 | 78.39 |
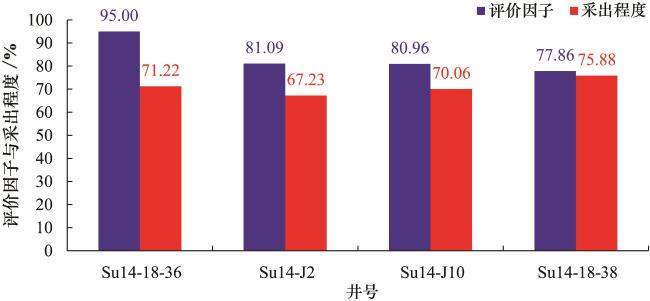
表4 模式二: Su14区块微重力监测区正负异常过渡区统计Table 4 Model two: Statistics of development wells in the positive and negative anomaly transition area of microgravity monitoring in block Su14 |
| 井名 | Grv 井/μgal | Grv e-max/μgal | Grv e-min/μgal | 评价因子/10-2 | 累计产量/(104 m3) | 动储量/(104 m3) | 采出程度/% |
|---|---|---|---|---|---|---|---|
| Su14-18-36 | 1.156 | 1.464 | -4.700 | 95.002 | 963 | 1 352 | 71.22 |
| Su14-J2 | 2.573 | 3.731 | -2.393 | 81.086 | 1 261 | 1 875 | 67.23 |
| Su14-J10 | 0.992 | 2.324 | -4.675 | 80.959 | 1 706 | 2 435 | 70.06 |
| Su14-18-38 | 4.279 | 5.736 | -0.846 | 77.860 | 4 493 | 5 922 | 75.88 |
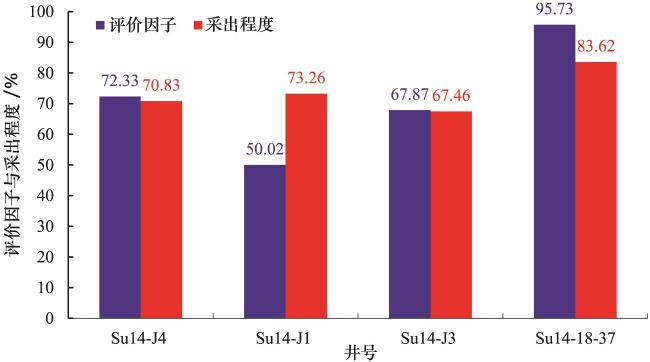
图7 正异常区开发井位附近剩余气开发潜力评价因子与采出程度对比条形图Fig.7 The comparing of bar graph between the development potential evaluation factors and the recovery degree of the remaining gas near the development well location in the positive anomaly area |
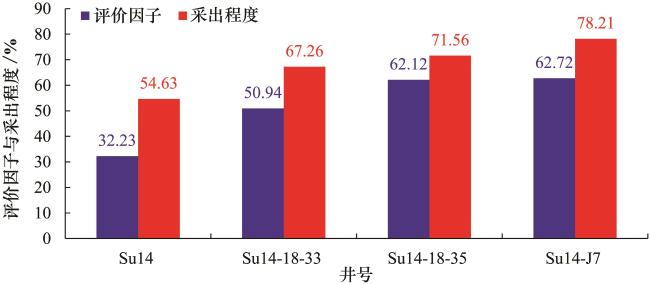
图8 负异常区开发井位附近剩余气开发潜力评价因子与采出程度对比条形图Fig.8 The comparing of bar graph between the development potential evaluation factors and the recovery degree of the remaining gas near the development well location in the negative anomaly area |
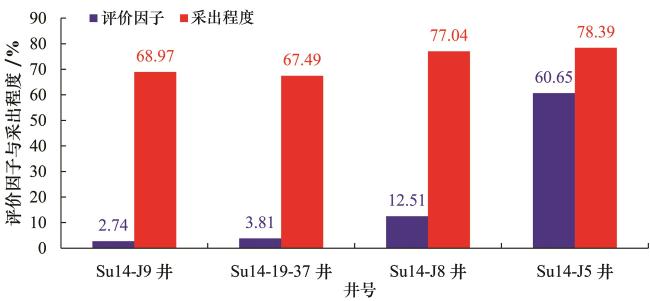
图9 模式一: 正负异常过渡区域开发井位附近剩余气开发潜力评价因子与采出程度对比条形图Fig.9 Model one: The comparing of bar graph between the development potential evaluation factors and the recovery degree of the remaining gas near the development well location in the positive and negative anomaly transition area |
3.3 挖潜措施及效果预测
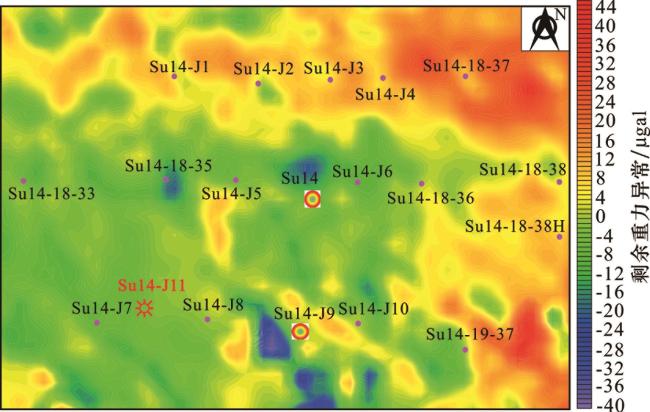
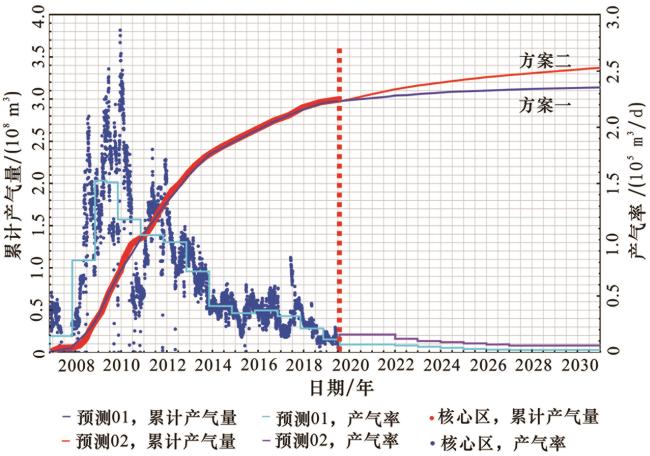
图12 核心区不同方案效果预测对比Fig.12 Comparison chart of effect prediction of different schemes in the core area |
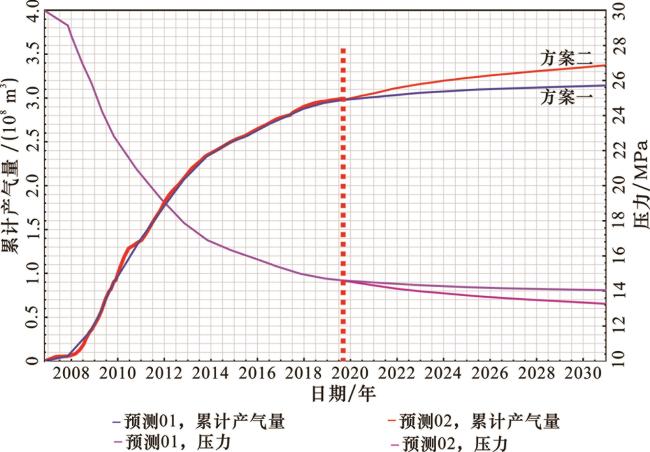
图13 核心区不同方案地层压力变化对比Fig.13 Comparison of formation pressure changes of different schemes in the core area |
表5 Su14加密试验区调整挖潜方案指标对比Table 5 Comparison table of indicators for adjustment of potential tapping schemes in Su14 encryption test area |
| 序号 | 对比内容 | 地质储量/(108 m³) | 井均累计产气量/(104 m³) | 工区累计产气量/(104 m³) | 采出程度/% |
|---|---|---|---|---|---|
| 方案一 | 目前投产井预测废弃期末 | 5.8 | 2 094 | 3.14 | 54.2 |
| 方案二 | 部署1口新井,老井增产2口 | 5.8 | 2 281 | 3.42 | 59.0 |
 甘公网安备 62010202000678号