0 引言
1 地质概况
2 构造沉积转换面的识别
2.1 地震反射特征差异
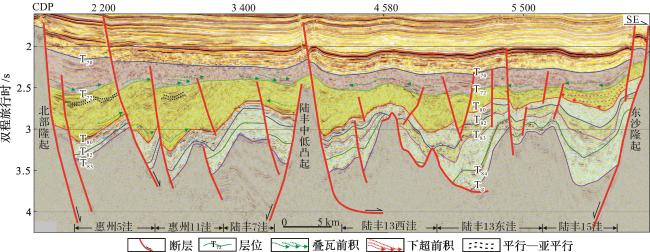
图2 过陆丰南—陆丰北区域地震解释剖面[剖面位置见图1(b)]Fig.2 Interpreted seismic profile across the south Lufeng area and north Lufeng area (the profile position is shown in Fig.1(b)) |
2.1.1 陆丰南半地堑局部不整合区
2.1.2 陆丰北部整合区
2.2 构造与地层形态差异
表1 陆丰凹陷古近系主要界面断裂发育情况统计Table 1 Statistic table showing the faults in the main Paleogene unconformities of the Lufeng Sag |
| 层位 | 陆丰南半地堑 | 陆丰北半地堑 | ||
|---|---|---|---|---|
| 断裂条数 /条 | 断裂密度 /(条/km2) | 断裂条数 /条 | 断裂密度 /(条/km2) | |
| T60 | 112 | 0.049 | 144 | 0.077 |
| T70 | 165 | 0.073 | 319 | 0.171 |
| T72 | 157 | 0.069 | 481 | 0.258 |
| T80 | 228 | 0.100 | 138 | 0.074 |


 甘公网安备 62010202000678号