引用本文
He Cong,Su Ao,Zhang Mingzhen,et al.Optimal selection and application of prediction means for organic carbon content of source rocks based on logging data in Yanchang Formation, Ordos Basin[J].Natural Gas Geoscience,2016,27(4):754-764.[贺聪,苏奥,张明震,等.鄂尔多斯盆地延长组烃源岩有机碳含量测井预测方法优选及应用[J].天然气地球科学,2016,27(4):754-764.]

doi:10.11764/j.issn.1672-1926.2016.04.0754
鄂尔多斯盆地延长组烃源岩有机碳含量测井预测方法优选及应用
关键词: 烃源岩 有机碳含量 测井预测 延长组 鄂尔多斯盆地
中图分类号:TE122.1 文献标志码:A 文章编号:1672-1926(2016)04-0754-11
Optimal selection and application of prediction means for organic carbon contentof source rocks based on logging data in Yanchang Formation,Ordos Basin
He Cong1,2 ,So Ao3,Zhang Ming-zhen1,Wu Yuan-dong1,2,Ji Li-ming1
Key words: Hydrocarbon source rocks; Organic carbon content; Prediction by well-logging data; Yanchang Formation; Ordos Basin;
引言
岩石中的有机质数量通常表示为总有机碳含量(TOC),它是反映岩石有机质丰度的主要指标和烃源岩评价、页岩气评价的主要特征参数之一。为了获得该指标参数,一般是对钻井岩心间隔一定距离进行采样,然后通过有机碳分析仪或岩石热解仪等测试或者计算得到。但这种方法仍然存在一些弊端,例如采样时可能漏掉富含有机质层位,或者采集到的是无效烃源岩样品,而且分析费用昂贵以及耗时较长、难以获得连续的烃源岩TOC值[1,2]。虽然高精地层元素能谱测井(Litho Scanner)可以提供单独的TOC测量,但该技术目前被国外公司垄断,较少应用到国内油气田[3]。 由于有机质与其宿主岩石中的矿物成分物理特性存在显著差异,例如低密度、低波速或高声波时差、高铀含量、高伽马值、高电阻率以及高氢和碳浓度等[4-6],而这些特征可以通过各种测井手段识别出来,因此国内外研究者提出了多种利用不同测井响应特征预测烃源岩TOC含量的方法,例如ΔlogR法[7,8]、自然伽马测井法[9-11]、体积密度测井法[3-12,13]、多元回归分析法[9-14-16]和BP神经网络预测模型[17-22]等。本文在借鉴这些理论研究成果及方法的基础上,结合鄂尔多斯盆地延长组地质特征及已有的测井和岩心资料开展研究,建立新的经验公式并进行误差分析得出最优预测方法,并尝试将其应用到鄂尔多斯盆地南部铜川地区YK1井延长组的连续地层有机碳含量预测以及获取潜在有效烃源岩的层位分布和TOC含量等详细特征。
1 地质概况
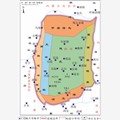
鄂尔多斯盆地是我国中部非常重要的含油气盆地,是发育在华北板块太古代麻粒岩和下元古界绿片岩基底之上的一个典型克拉通盆地[23] ;同时,它也是华北克拉通最稳定的一部分,在中生代之前属于华北古陆伸向秦祁海域的台地边缘区,晚三叠世开始由于华北地台西缘受到自西向东挤压而形成坳陷型盆地,白垩纪晋西地区隆起后形成独立的盆地[24,25],现今被划分为6个构造分区(图1)。印支期华北克拉通逐渐萎缩,进入鄂尔多斯内陆盆地演化阶段,形成了一套东北部较浅、西南部较深的总厚度超过1 000m的河湖相—三角洲相碎屑沉积,即延长组建造[25,26],是盆地中生界主要的生、储岩系。延长组在鄂尔多斯盆地东北部、北部、西北部、西南部和东南部等四周都有物源区,它们在盆地中形成明显的由河流沉积、三角洲沉积、半深湖沉积所组成的环状相带,使延长组经历了内陆湖泊产生、发展乃至消亡的完整过程;根据凝灰岩和泥页岩标志层自下而上被划分为长10—长1共10个油层组,盆地南部有些地区延长组顶部为长4+5或者局部地区仅存长3部分地层[24]。其中长1+2段、长6段、长8段和长10段是主要储油层,尤其是长6段和长8段是以砂岩为主的主力层段,而长7段为暗色泥页岩主要生油层,局部地区长2段、长4+5段和长9段也发育一定的泥质烃源岩[27,28]。这些烃源岩现今处于中等成熟的大量生油阶段,镜质体反射率RO值大多处于0.5%~1.0%之间[29-31]。本文涉及到的4口钻井都位于盆地现今南半部区域,其中丹48井更靠近湖盆中央以及盆地现今中部地区,而YK1井位于铜川,更靠近盆地现今南部边缘(图1),YK1井钻遇地层为长4+5段—长10段,顶部缺失长1—长3段地层。
2 有机碳含量测井预测方法
2.1 自然伽马测井法
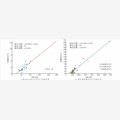
自然伽马(GR)测井记录了地层中来自40K、U和Th衰变系元素的放射性强度,大量研究数据表明放射性强度与有机质含量之间具有良好的相关性[9,10-32]。烃源岩U含量与TOC含量之间存在正相关关系,具有高U含量的泥页岩中通常TOC含量也高,这可能是通过沉积物—水界面的扩散作用将U从水中脱离并最终残留在有机质页岩中[33-35],有机质在被压薄过程中的吸附作用也可能是烃源岩U富集的重要因素[36]。Mendelson等[9]曾发现了北海Kimmerldge页岩伽马射线强度与有机质丰度的关系,根据岩心实测TOC含量与自然伽马测井响应,得到了较好的线性关系,即TOC=0.089·Υ-1.693,相关系数r=0.810[图2(a)]。在借鉴该研究的基础上,结合鄂尔多斯盆地延长组烃源岩TOC含量与测井值拟合关系中GR与TOC具有最高的相关性[图2(b),表1],即两者的“共变趋势”最显著,可以用其中的一个变量来预测另外一个变量。假设GR测井线性模型,即TOC=a·Υ+b,其中Υ为自然伽马测井值(单位:API),a、b为地区经验系数。拟合鄂尔多斯盆地丹48(D48)井、里94(L94)井和庄40(Z40)井延长组共89个泥质烃源岩
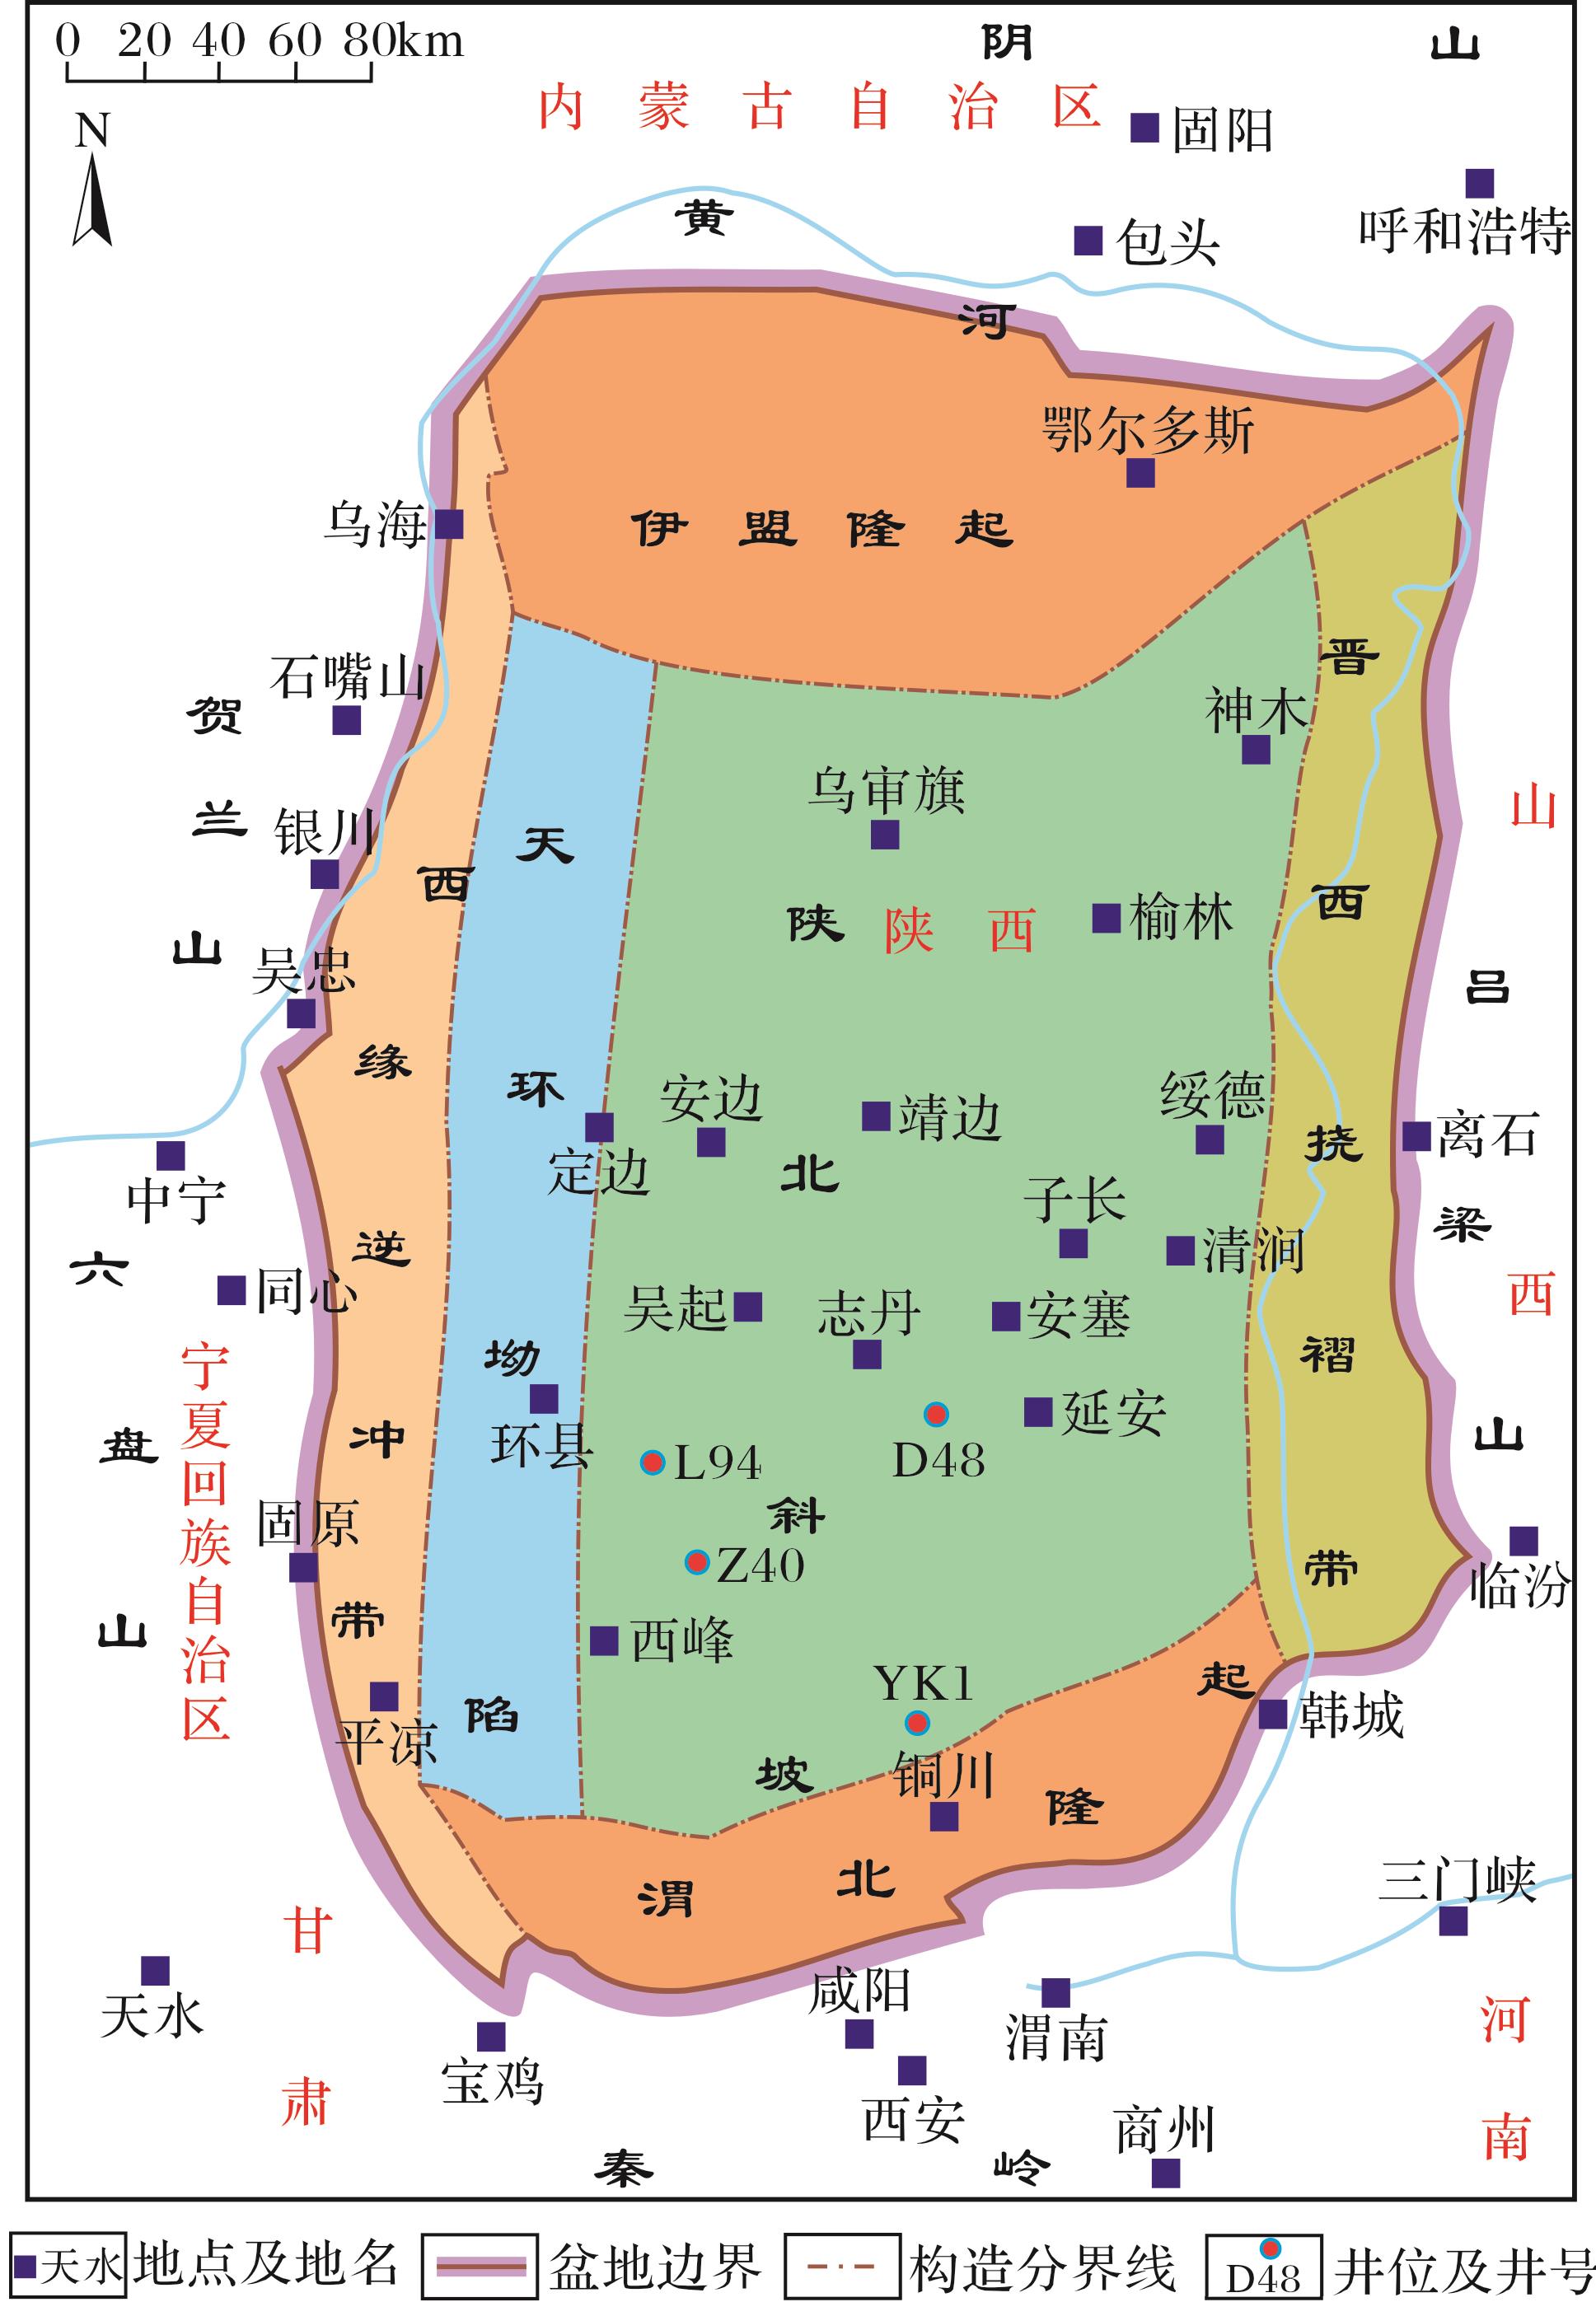
图1 鄂尔多斯盆地构造分区及钻井位置
Fig.1 Geotectonic areal division of Ordos Basin and drilling position
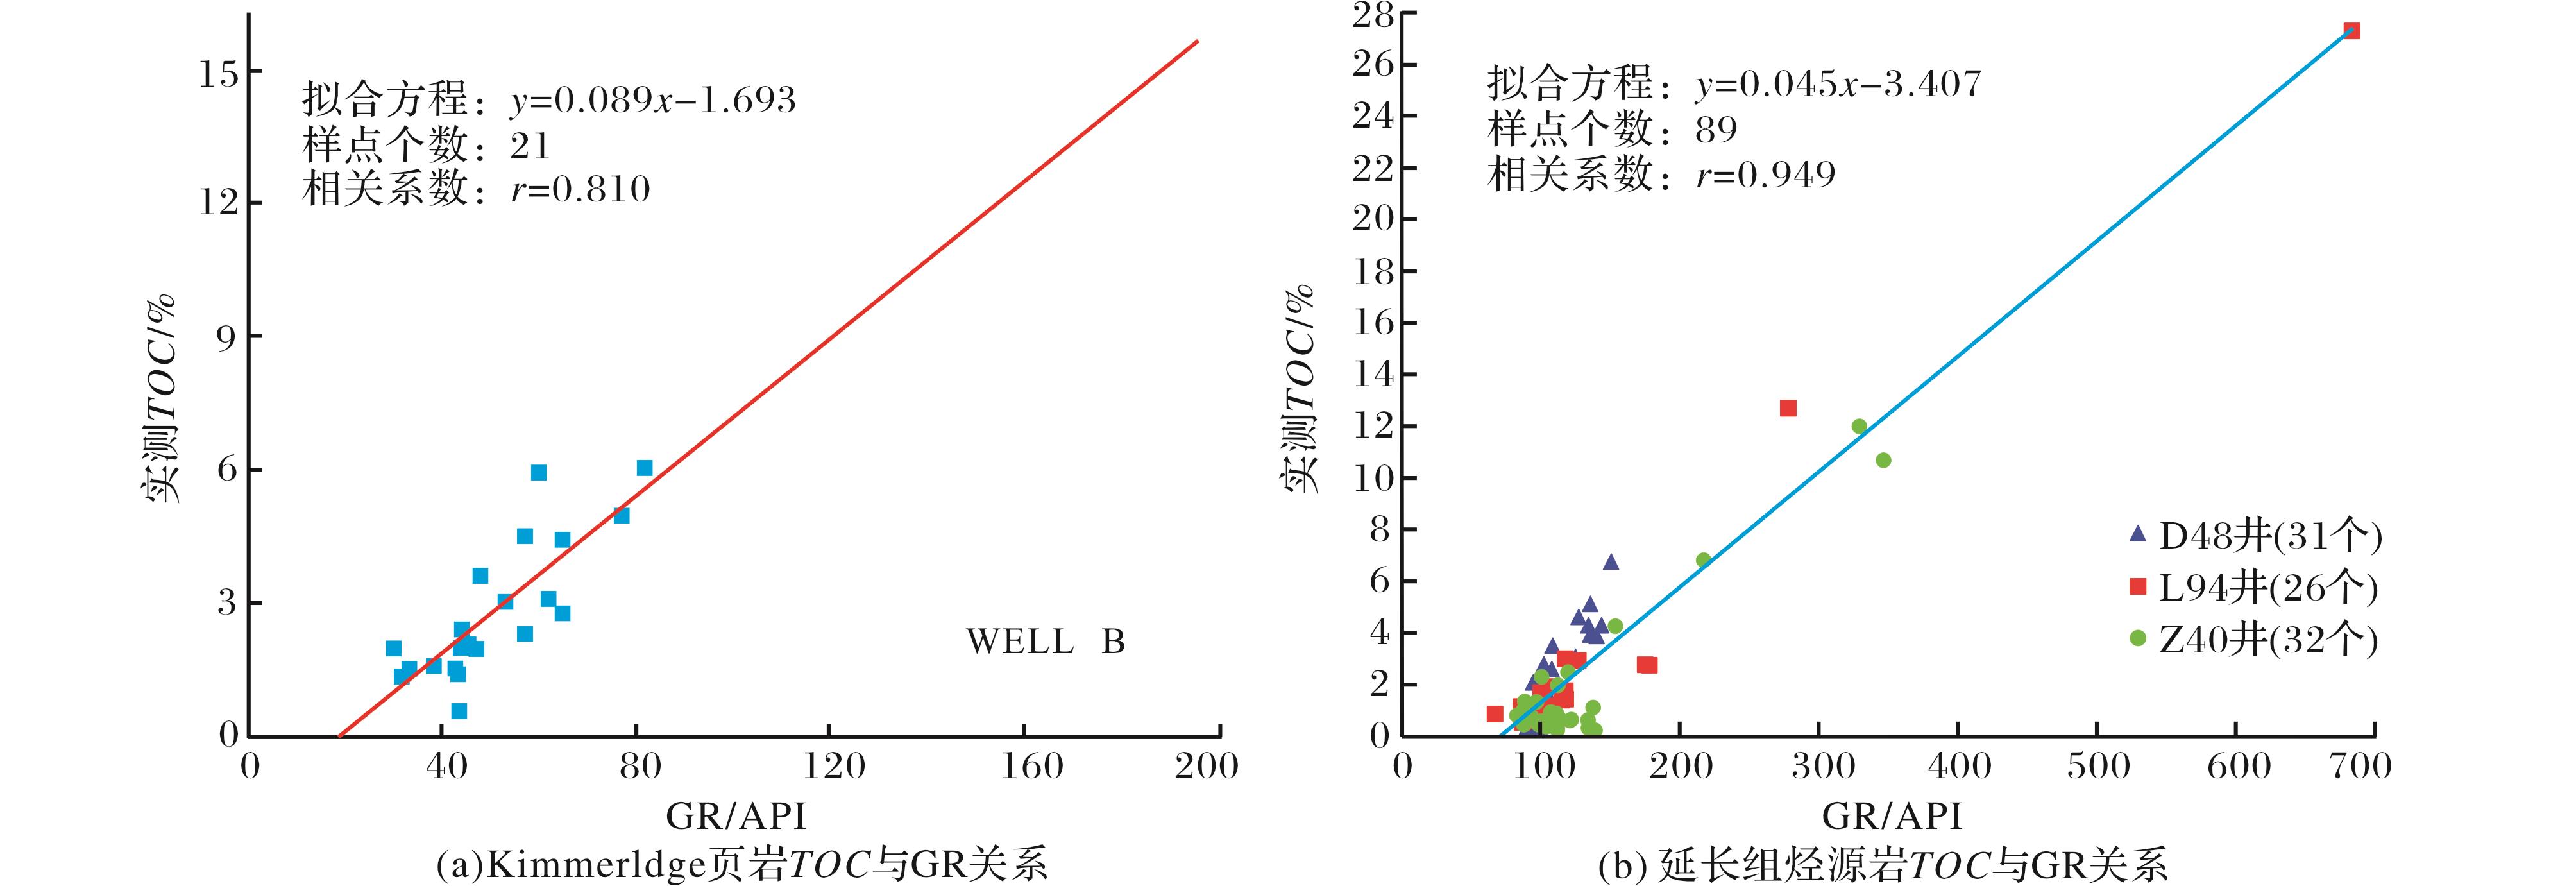
图2 自然伽马测井(GR)与总有机碳含量(TOC)关系
Fig.2 Relationship between TOC content and GR value
Table 1 Logging fitting relationship for TOC content of Yanchang Formation source rock
| 参数 | 自然伽马(GR) | 体积密度(DEN) | 声波时差(AC) | 自然电位(SP) |
| TOC | y=0.045x-3.407 | y=-36.26x+95.38 | y=0.072x-14.76 | y=-0.131x+12.42 |
| r | 0.949 | -0.884 | 0.624 | -0.693 |
2.2 体积密度测井法
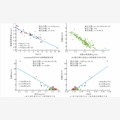
泥页岩中有机质的密度(1.03~1.10g/cm3)比围岩基质的密度(黏土骨架密度为2.30~3.10g/cm3)小,使得含有机质泥页岩的岩性密度测井值降低,因此可以利用密度(DEN)测井来估算有机质的含量[3-10-13-37]。Decker等[12]、黄仁春等[3]研究证明泥页岩的TOC含量与体积密度存在良好的线性关系,并且呈反比关系[图3(a),图3(b)]。Schmoker等[13]曾针对Bakken页岩提出了利用密度测井曲线计算TOC含量的经验公式为:TOC=A/ρ+B,其中ρ为密度测井值(单位:g/cm3),A、B为局部地层组段或地区经验系数;而黄仁春等[3]提出的利用密度测井曲线计算焦石坝气田页岩储层TOC含量的模型为:TOC=A·ρ+B。本文根据鄂尔多斯盆地延长组烃源岩岩心实测TOC值,比较了其与密度测井DEN以及与1/DEN的相关性[图3(c),图3(d)],发现TOC含量与1/DEN的相关性要稍微好于与DEN的相关性,但相差不大。TOC含量与DEN测井值的拟合方程为:TOC=-36.26·ρ+95.38,相关系数r=-0.884;而TOC含量与1/DEN的拟合方程为:TOC=223.2/ρ-84.79,相关系数r=0.909。 不过需要注意的是,在存在重矿物的情况下会对密度测井产生显著影响,例如黄铁矿,因此如果能够根据黄铁矿与有机质之间的线性关系对模型进行校正可能会提高TOC含量预测的精度[3-13]。
2.3 多元回归分析法
Mendelson等[9]曾指出,如果存在2个或多个与因变量有较好相关性的不相关自变量,多元回归结果通常优于单因素分析结果,多元回归方程可以根据各个数据集的相关矩阵计算获得。应用较多的预测TOC含量的多元回归方程是基于声波时差、中子、密度和自然伽马测井模型:TOC=A·Δt+B·ΦN+C·ρ+D·Υ+E(其中A、B、C、D是系数,E为常数或者为0,Δt、ΦN、ρ和Υ分别为声波时差测井、中子测井、密度测井和自然伽马测井值,式中的系数通过对研究区系统采集样品分析根据最小二乘法拟合获得[9-14-16]。本文根据仅有的自然伽马、密度、声波时差和自然电位4条测井数据进行多元回归分析,并且延长组烃源岩TOC与GR测井和DEN测井有强相关关系、与AC测井和SP测井有中等相关关系(表1),假设鄂尔多斯盆地延长组具有类似的预测模型即TOC=A·Υ+B·ρ+C·Δt+D·SP+E,其中SP为自然电位测井值(单位:mV)。通过回归统计得到常系数不为0以及常系数为0的回归方程分别为:
2.4 BP神经网络模型法
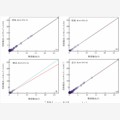
人工神经网络是一种用来解决非线性复杂问题的智能系统。反向传播人工神经网络(BP神经网络)是计算训练数据集中的期望输出值与神经网络估算值之间误差的一种监督训练技术,其误差通过网络向后传播并且在大量迭代中调整权值,当估算输出值最接近期望输出值时训练停止[22]。神经网 络方法已经成功应用于多种与石油工程应用相关的
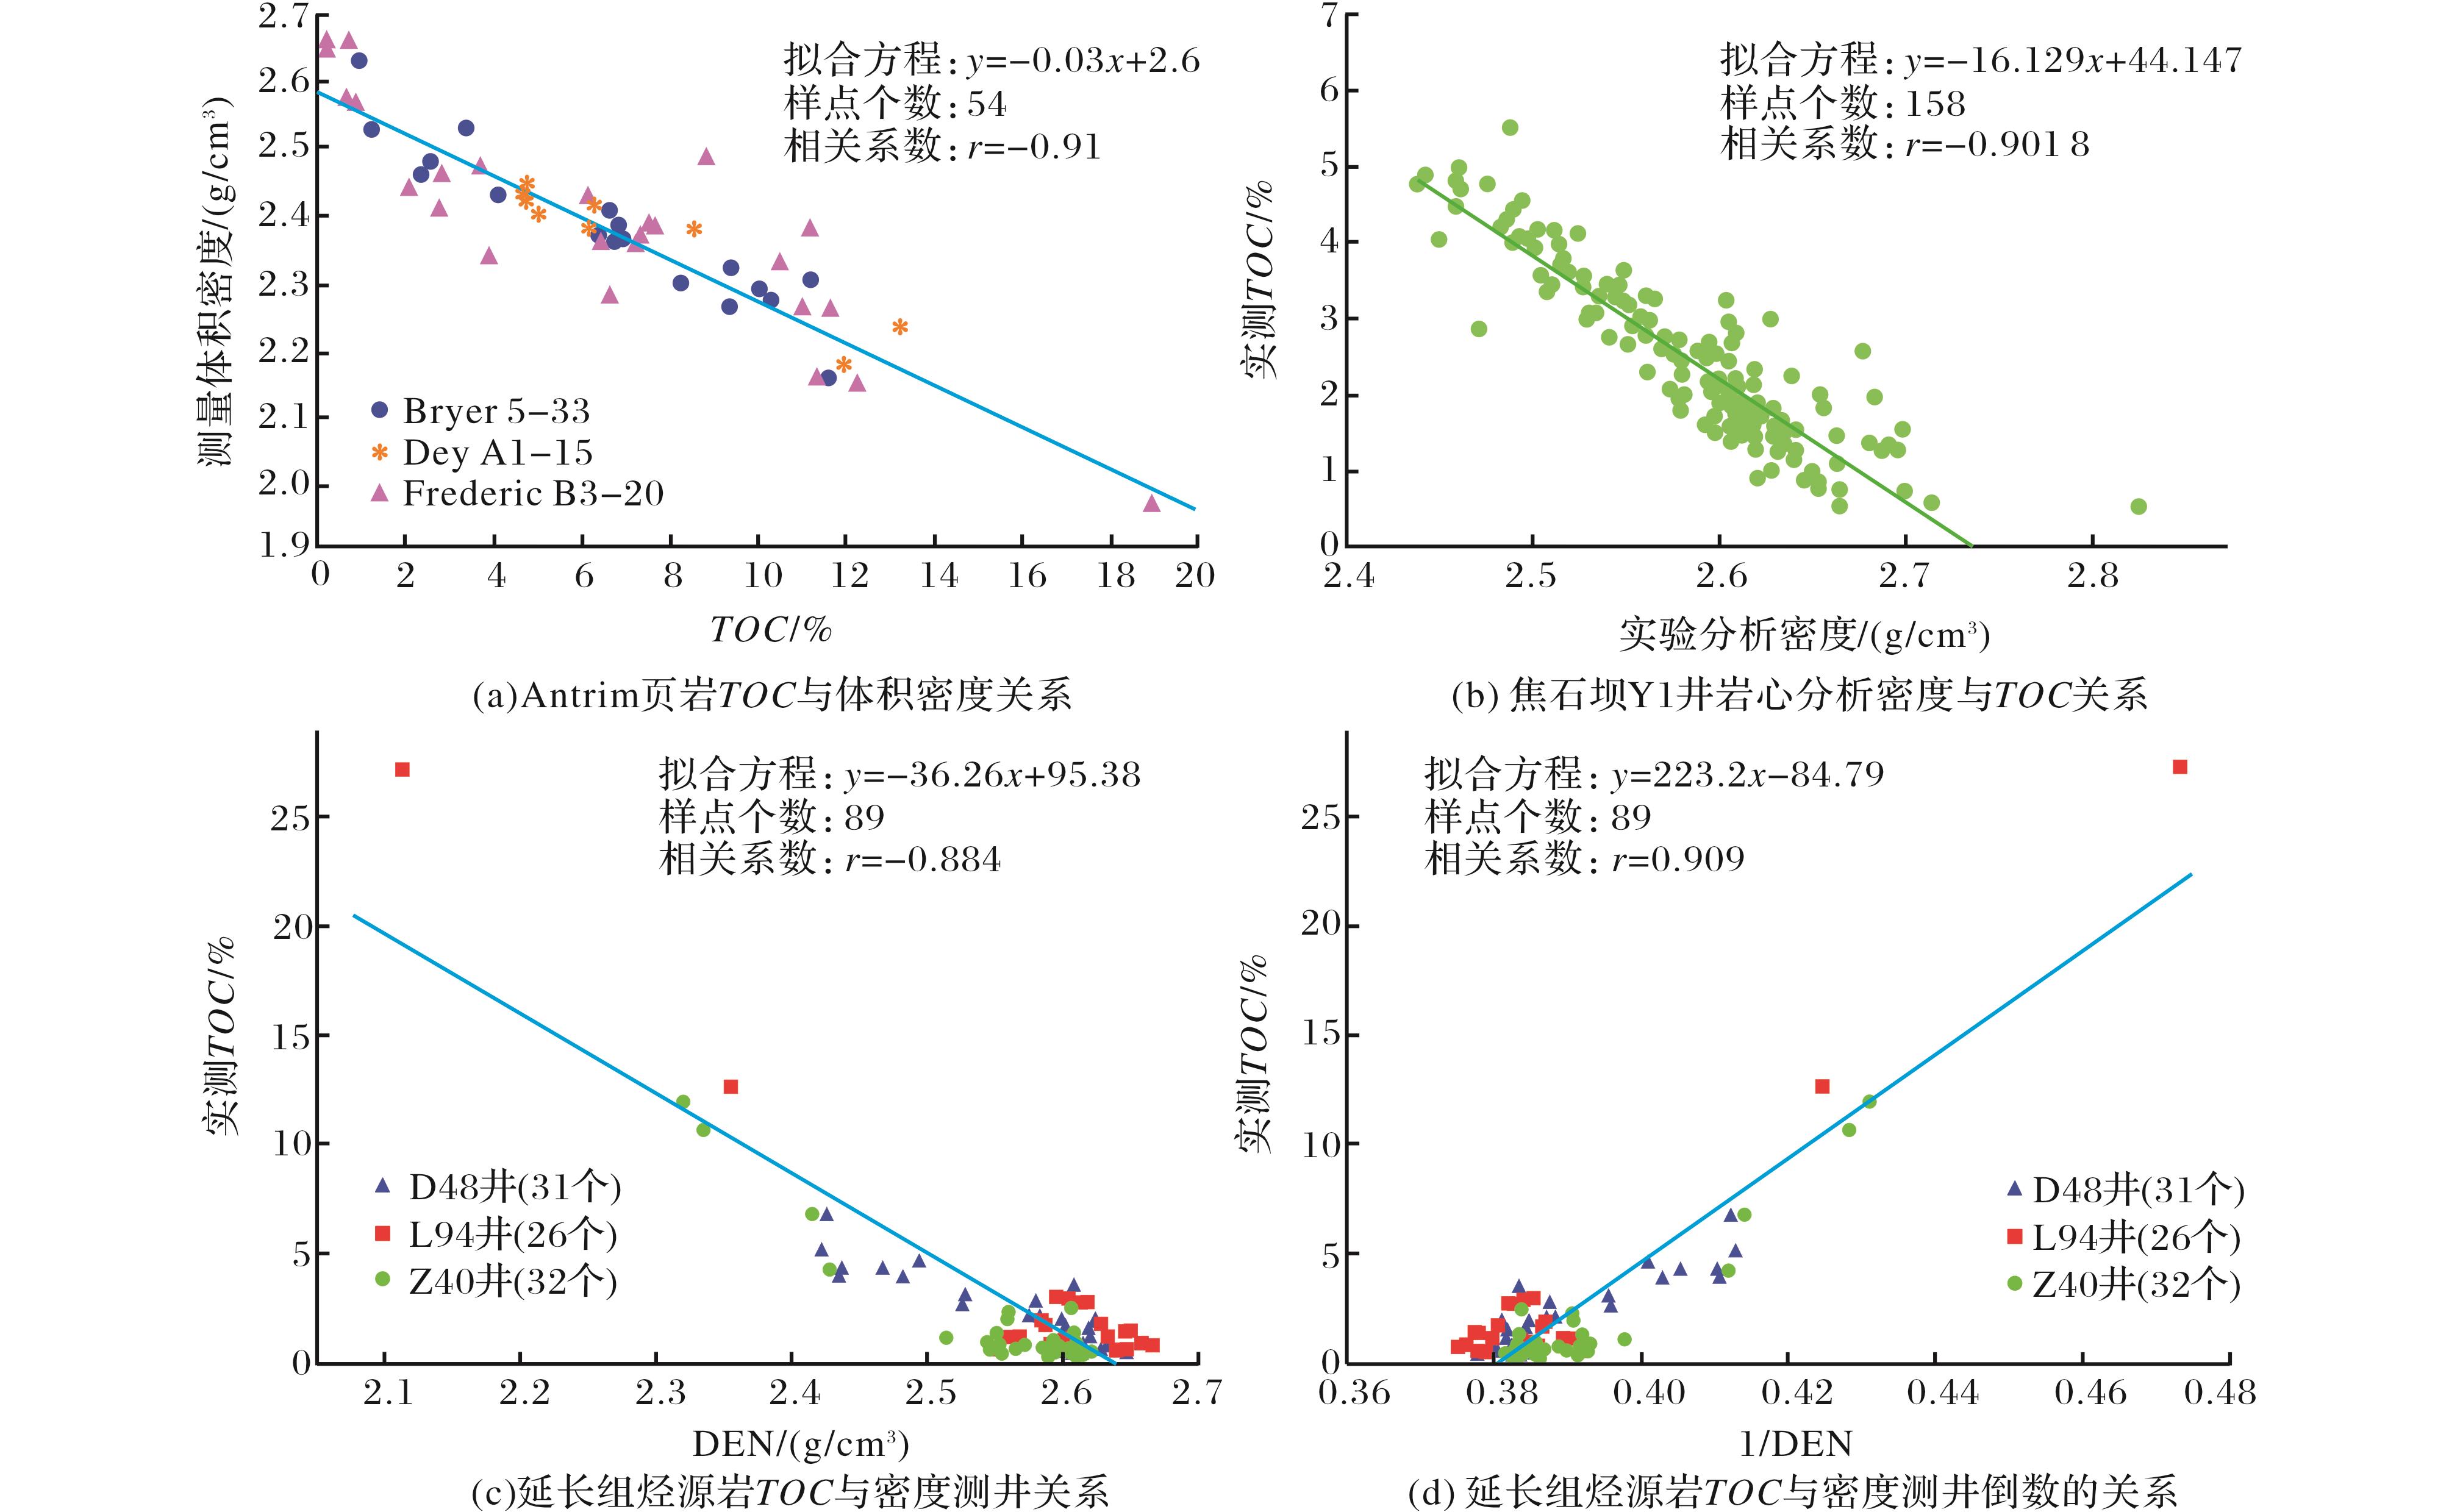
图3 体积密度(测井)与TOC含量关系
Fig.3 Relationship between TOC content and density
Table 2 Weight and threshold value of BP neural network model
| 权值 | 输入层到隐含层权值wij | 阈值bj | ||||||
| 1 | 2 | 3 | 4 | |||||
| 1 | -1.302 4 | 1.322 6 | -0.592 05 | 0.645 2 | 2.794 2 | |||
| 2 | 0.531 97 | -2.537 9 | 1.735 5 | 1.172 | 1.268 7 | |||
| 3 | -1.06 61 | 0.864 05 | -0.253 72 | 2.437 2 | 0.054 98 | |||
| 4 | -2.776 3 | 1.217 8 | -1.300 4 | 1.036 | -0.583 | |||
| 5 | -1.202 9 | 1.900 7 | -2.696 1 | 1.133 2 | 1.639 9 | |||
| 6 | 0.309 99 | 1.986 4 | -1.059 1 | -0.987 9 | 1.049 5 | |||
| 7 | 1.838 6 | -1.839 8 | 1.501 6 | 0.517 62 | 0.650 31 | |||
| 8 | -0.258 38 | -0.498 18 | -0.680 93 | -2.269 | 2.861 9 | |||
| 隐含层至输出层权值vjk | 阈值ak | |||||||
| 1 | 2 | 3 | 4 | 5 | 6 | 7 | 8 | |
| -2.637 5 | 5.869 5 | 0.428 99 | 0.137 89 | -1.687 9 | -2.485 1 | 5.961 4 | 3.673 4 | -2.999 4 |
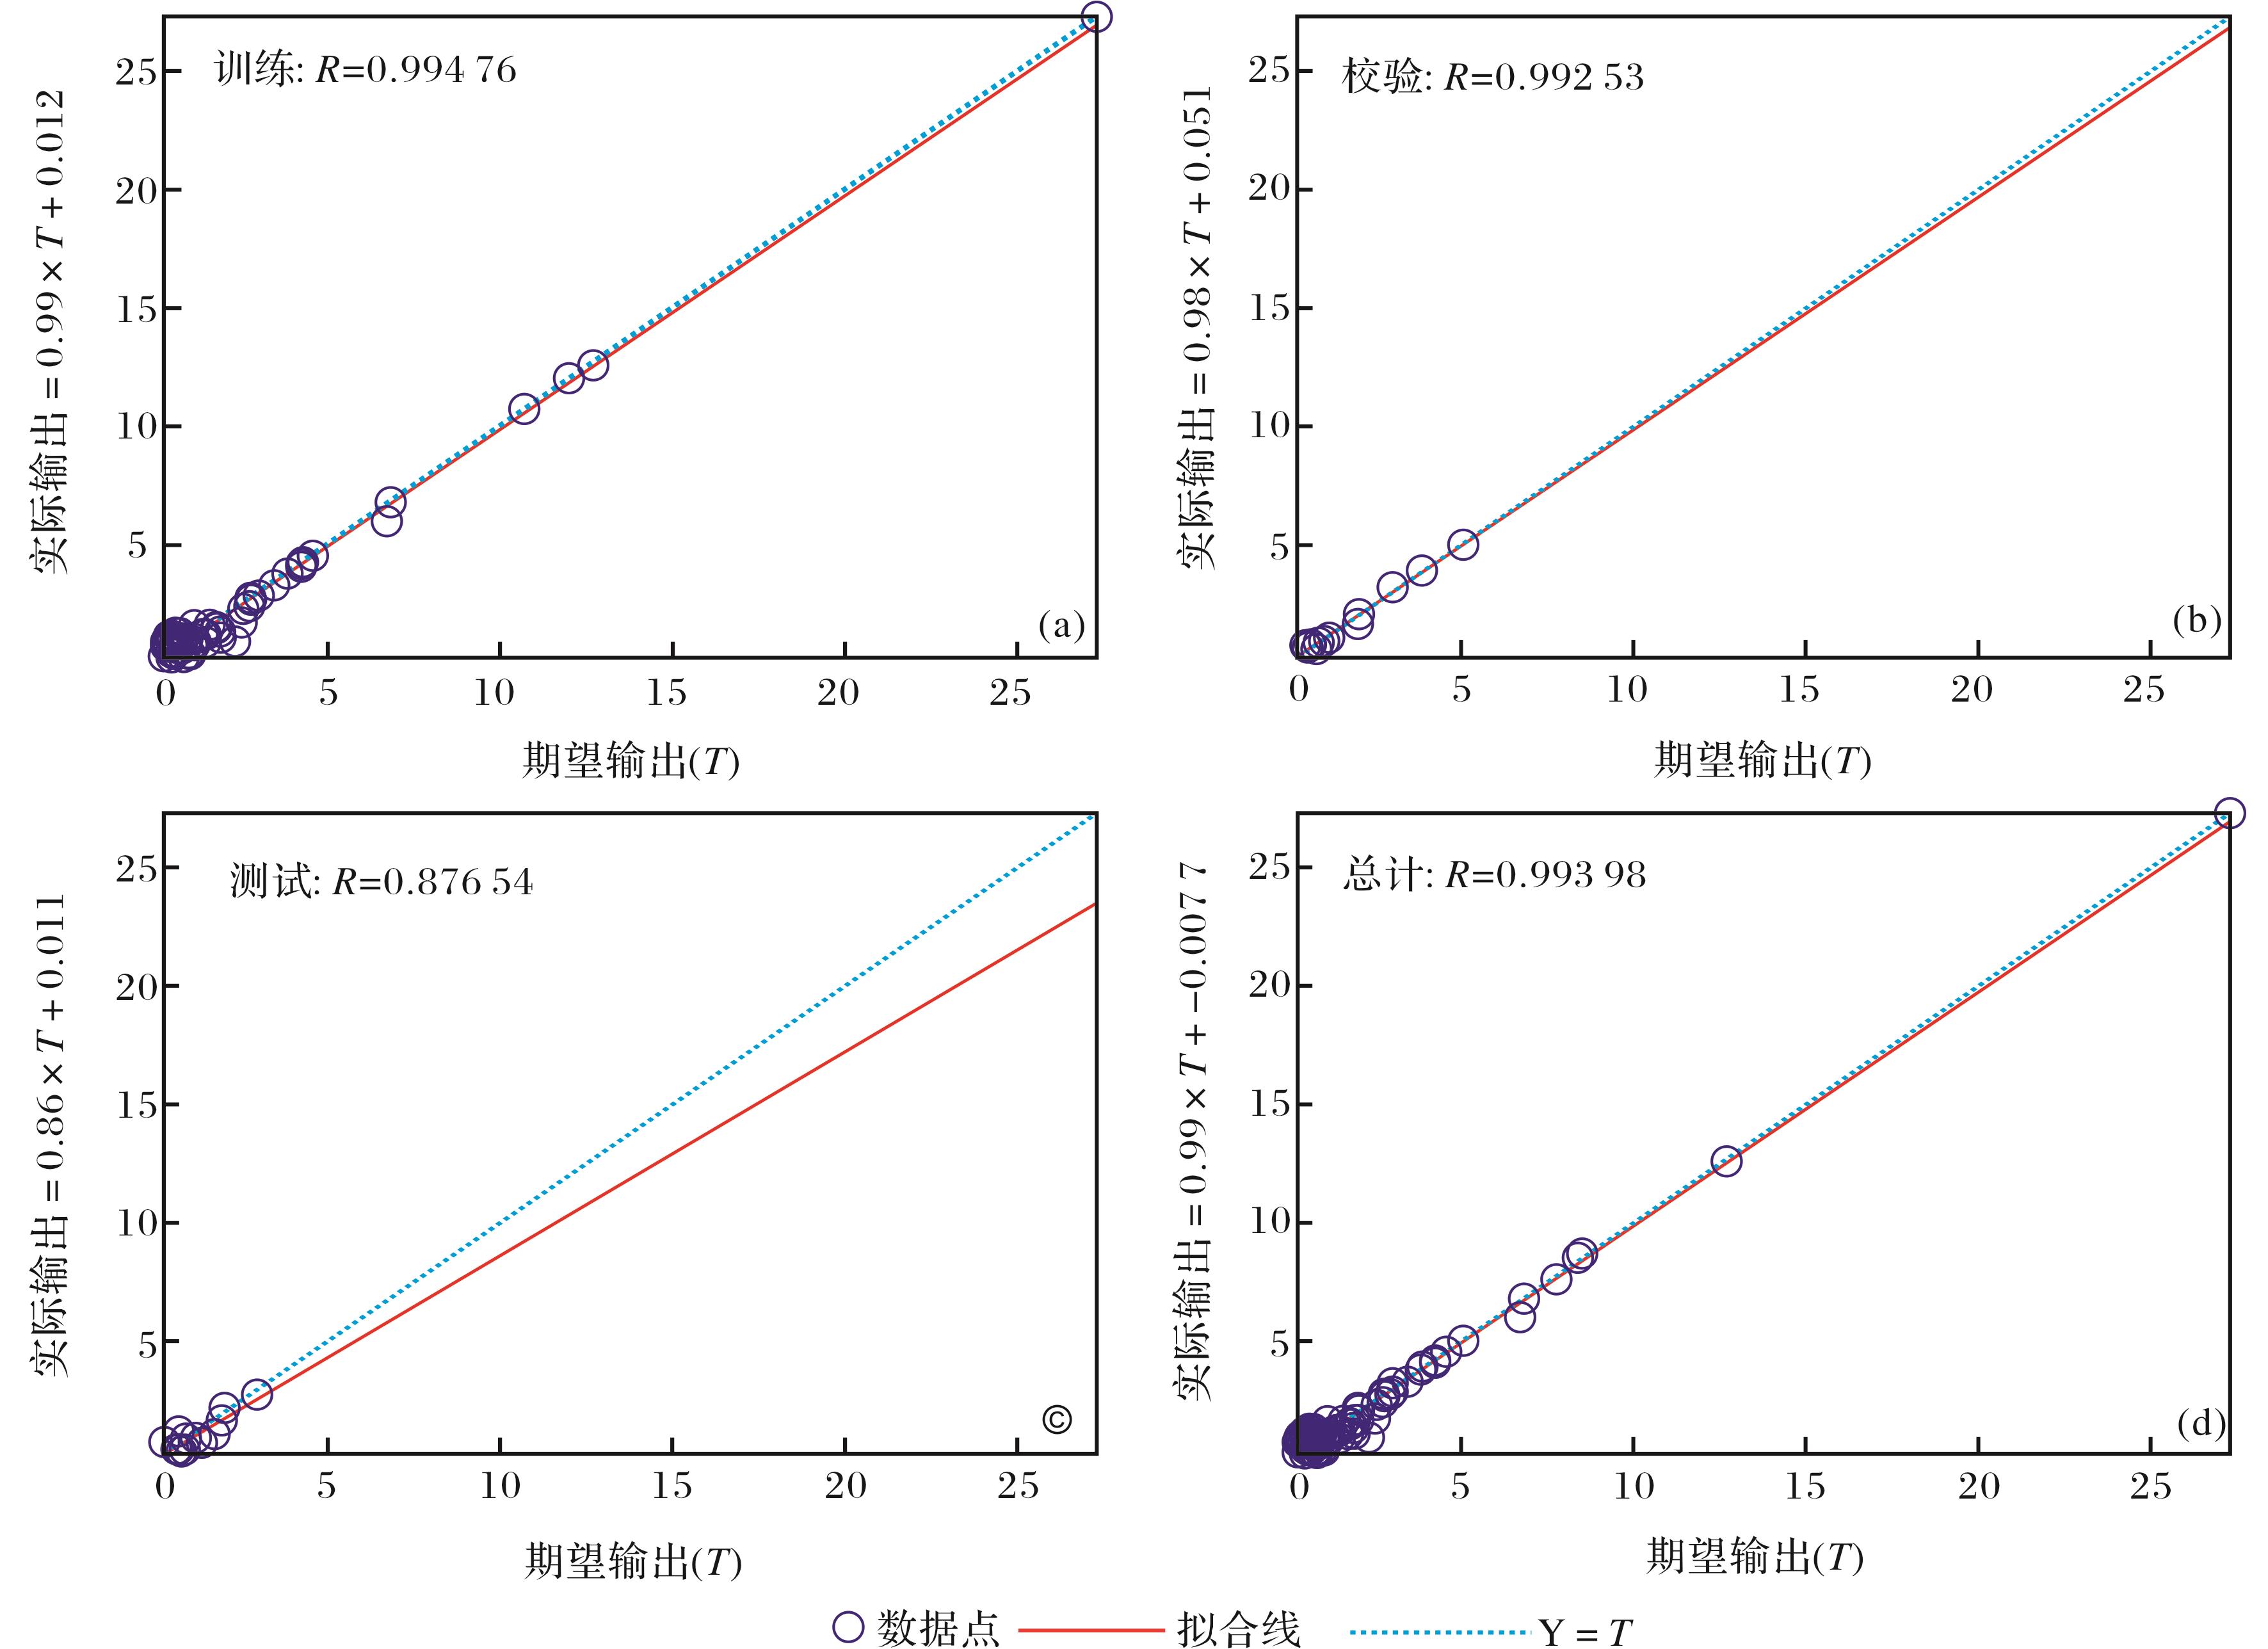
图4 不同阶段实际输出与期望输出之间的回归分析
Fig.4 Regression plots showing correlation coefficients between target and predicted TOC for different stages
3 预测方法对比优选
应用上述方法分别对D48井、L94井、Z40井以及这3口井延长组的综合数据进行岩心样本TOC含量实验室测试值与测井计算值进行对比分析(表3),其中自然伽马(GR)测井法采用经验公式TOC=0.045·Υ-3.407,体积密度(DEN)测井法采用经验公式TOC=223.2/ρ-84.79,多元回归法采用经验公式TOC=0.035 518·Υ-1.360 97·ρ+0.016 69·Δt-0.033 82·SP,而BP神经网络法采用n=4、m=8、k=1的模型。考虑到研究区地层测井值可能受其他因素的干扰,例如自然伽马测井受凝灰质火山岩的干扰以及密度测井受黄铁矿等的干扰而掩盖了与TOC含量的关系,在总样本数据中适当去除极少数与拟合线偏离较大的点以及个别因为室内实验操作不当得到的明显不合理值(如具有异常高GR值、TOC含量却很低的异常点以及具有异常高密度测井值、TOC含量却很高的异常点)后最终得到分析采用数据(表3),但同一口井不同方法采用的样本数据相同。
Table 3 Comparison of errors between measured TOC from cores and predicted TOC by different means
| 预测 方法 | 井号 | TOC平均值/% | TOC平均值/% | 平均绝对 误差(MAE) | 平均相对 误差/% | 均方误差 (MSE) | 相关 系数 | 采用数 据点/个 | |
| 测井计算 | 岩心实测 | ||||||||
| GR测井法 | D48 | 1.50 | 2.10 | 0.892 | 42.48 | 1.368 | 0.897 | 31 | |
| L94 | 2.76 | 2.79 | 0.695 | 24.91 | 1.061 | 0.982 | 26 | ||
| Z40 | 2.32 | 1.81 | 0.912 | 50.39 | 1.186 | 0.939 | 32 | ||
| 综合 | 2.16 | 2.20 | 0.842 | 38.27 | 1.213 | 0.949 | 89 | ||
| DEN测井法 | D48 | 2.19 | 2.10 | 0.904 | 43.05 | 1.440 | 0.887 | 31 | |
| L94 | 1.73 | 2.79 | 1.472 | 52.76 | 3.732 | 0.969 | 26 | ||
| Z40 | 2.54 | 1.81 | 0.926 | 51.16 | 1.511 | 0.936 | 32 | ||
| 综合 | 2.18 | 2.20 | 1.078 | 49 | 2.135 | 0.909 | 89 | ||
| 多元回归法 | D48 | 2.15 | 2.10 | 0.621 | 29.57 | 0.604 | 0.883 | 31 | |
| L94 | 2.59 | 2.79 | 0.539 | 19.32 | 0.551 | 0.991 | 26 | ||
| Z40 | 1.92 | 1.81 | 0.687 | 37.96 | 0.673 | 0.957 | 32 | ||
| 综合 | 2.195 | 2.199 | 0.620 | 28.19 | 0.613 | 0.982 | 89 | ||
| BP网络模型 | D48 | 2.11 | 2.10 | 0.159 | 7.57 | 0.022 | 0.972 | 31 | |
| L94 | 2.66 | 2.79 | 0.083 | 2.97 | 0.025 | 0.998 | 26 | ||
| Z40 | 1.80 | 1.81 | 0.172 | 9.50 | 0.017 | 0.987 | 32 | ||
| 综合 | 2.16 | 2.20 | 0.135 | 6.14 | 0.021 | 0.994 | 89 | ||
注:平均绝对误差=∑,平均相对误差=,
4 优选方法应用
4.1 识别YK1井有效烃源岩层
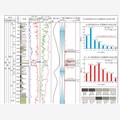
利用上述优选出来的BP神经网络模型,对鄂尔多斯盆地南部铜川地区YK1井延长组连续地层进行TOC含量预测结果如图5。图5中井段总长度为461m,测井数据采样间隔为0.050m,因此获得 预测的TOC值样点数总计为9 220个。石油天然气行业标准《陆相烃源岩地球化学评价方法》[38]将淡水—半咸水湖盆水体类型中的低成熟陆相烃源岩有机质丰度TOC值介于1.0%~2.0%之间定义为好生油岩类型,TOC>2.0%为最好生油岩类型(表4);而高岗等[39]利用有机碳与氯仿沥青“A”转化率、热解有机质相对生烃量的关系,认为鄂尔多斯盆地延长组湖相有效泥质烃源岩的有机质丰度(TOC)下限值应该为1.10%。考虑到延长组烃源岩整体处于中等成熟的大量生油阶段(RO值大多为0.5%~1.0%)[29-31],以及本文方法的计算误差,综合上述2个标准,同时为便于统计,将研究区有效烃源岩的有机质丰度(TOC)下限值定为1.0%,并且连续厚度大于5m。YK1井地层TOC含量预测结果(图5)表明,研究区发育4段厚度较大的有效烃源岩,分别位于长17段、长27段、长37段和长19段。延长组经历了湖盆从形成到消退的完整过程,其中长7段沉积期处于湖平面最高阶段[40],而通常有效烃源岩是高水位体系域的深湖相沉积物,长7段一般也被认为沉积了最大湖泛面时期的凝缩层,即有效烃源岩层。从图5中的岩性柱中也可以看到,这4段有效烃源岩都是以黑色油页岩为主,长7段下部长27—长37段属于区域性分布的“张家滩油页岩”,长19段属于“李家畔油页岩”,而长6段和长8段是以砂岩为主的储层。因此,上述优选出来的BP神经网络预测模型对研究区有效烃源岩的识别比较准确。 在YK1井识别出的4段有效烃源岩中,第1段的厚度大约为10m,TOC含量为1.0%~8.0%,位于
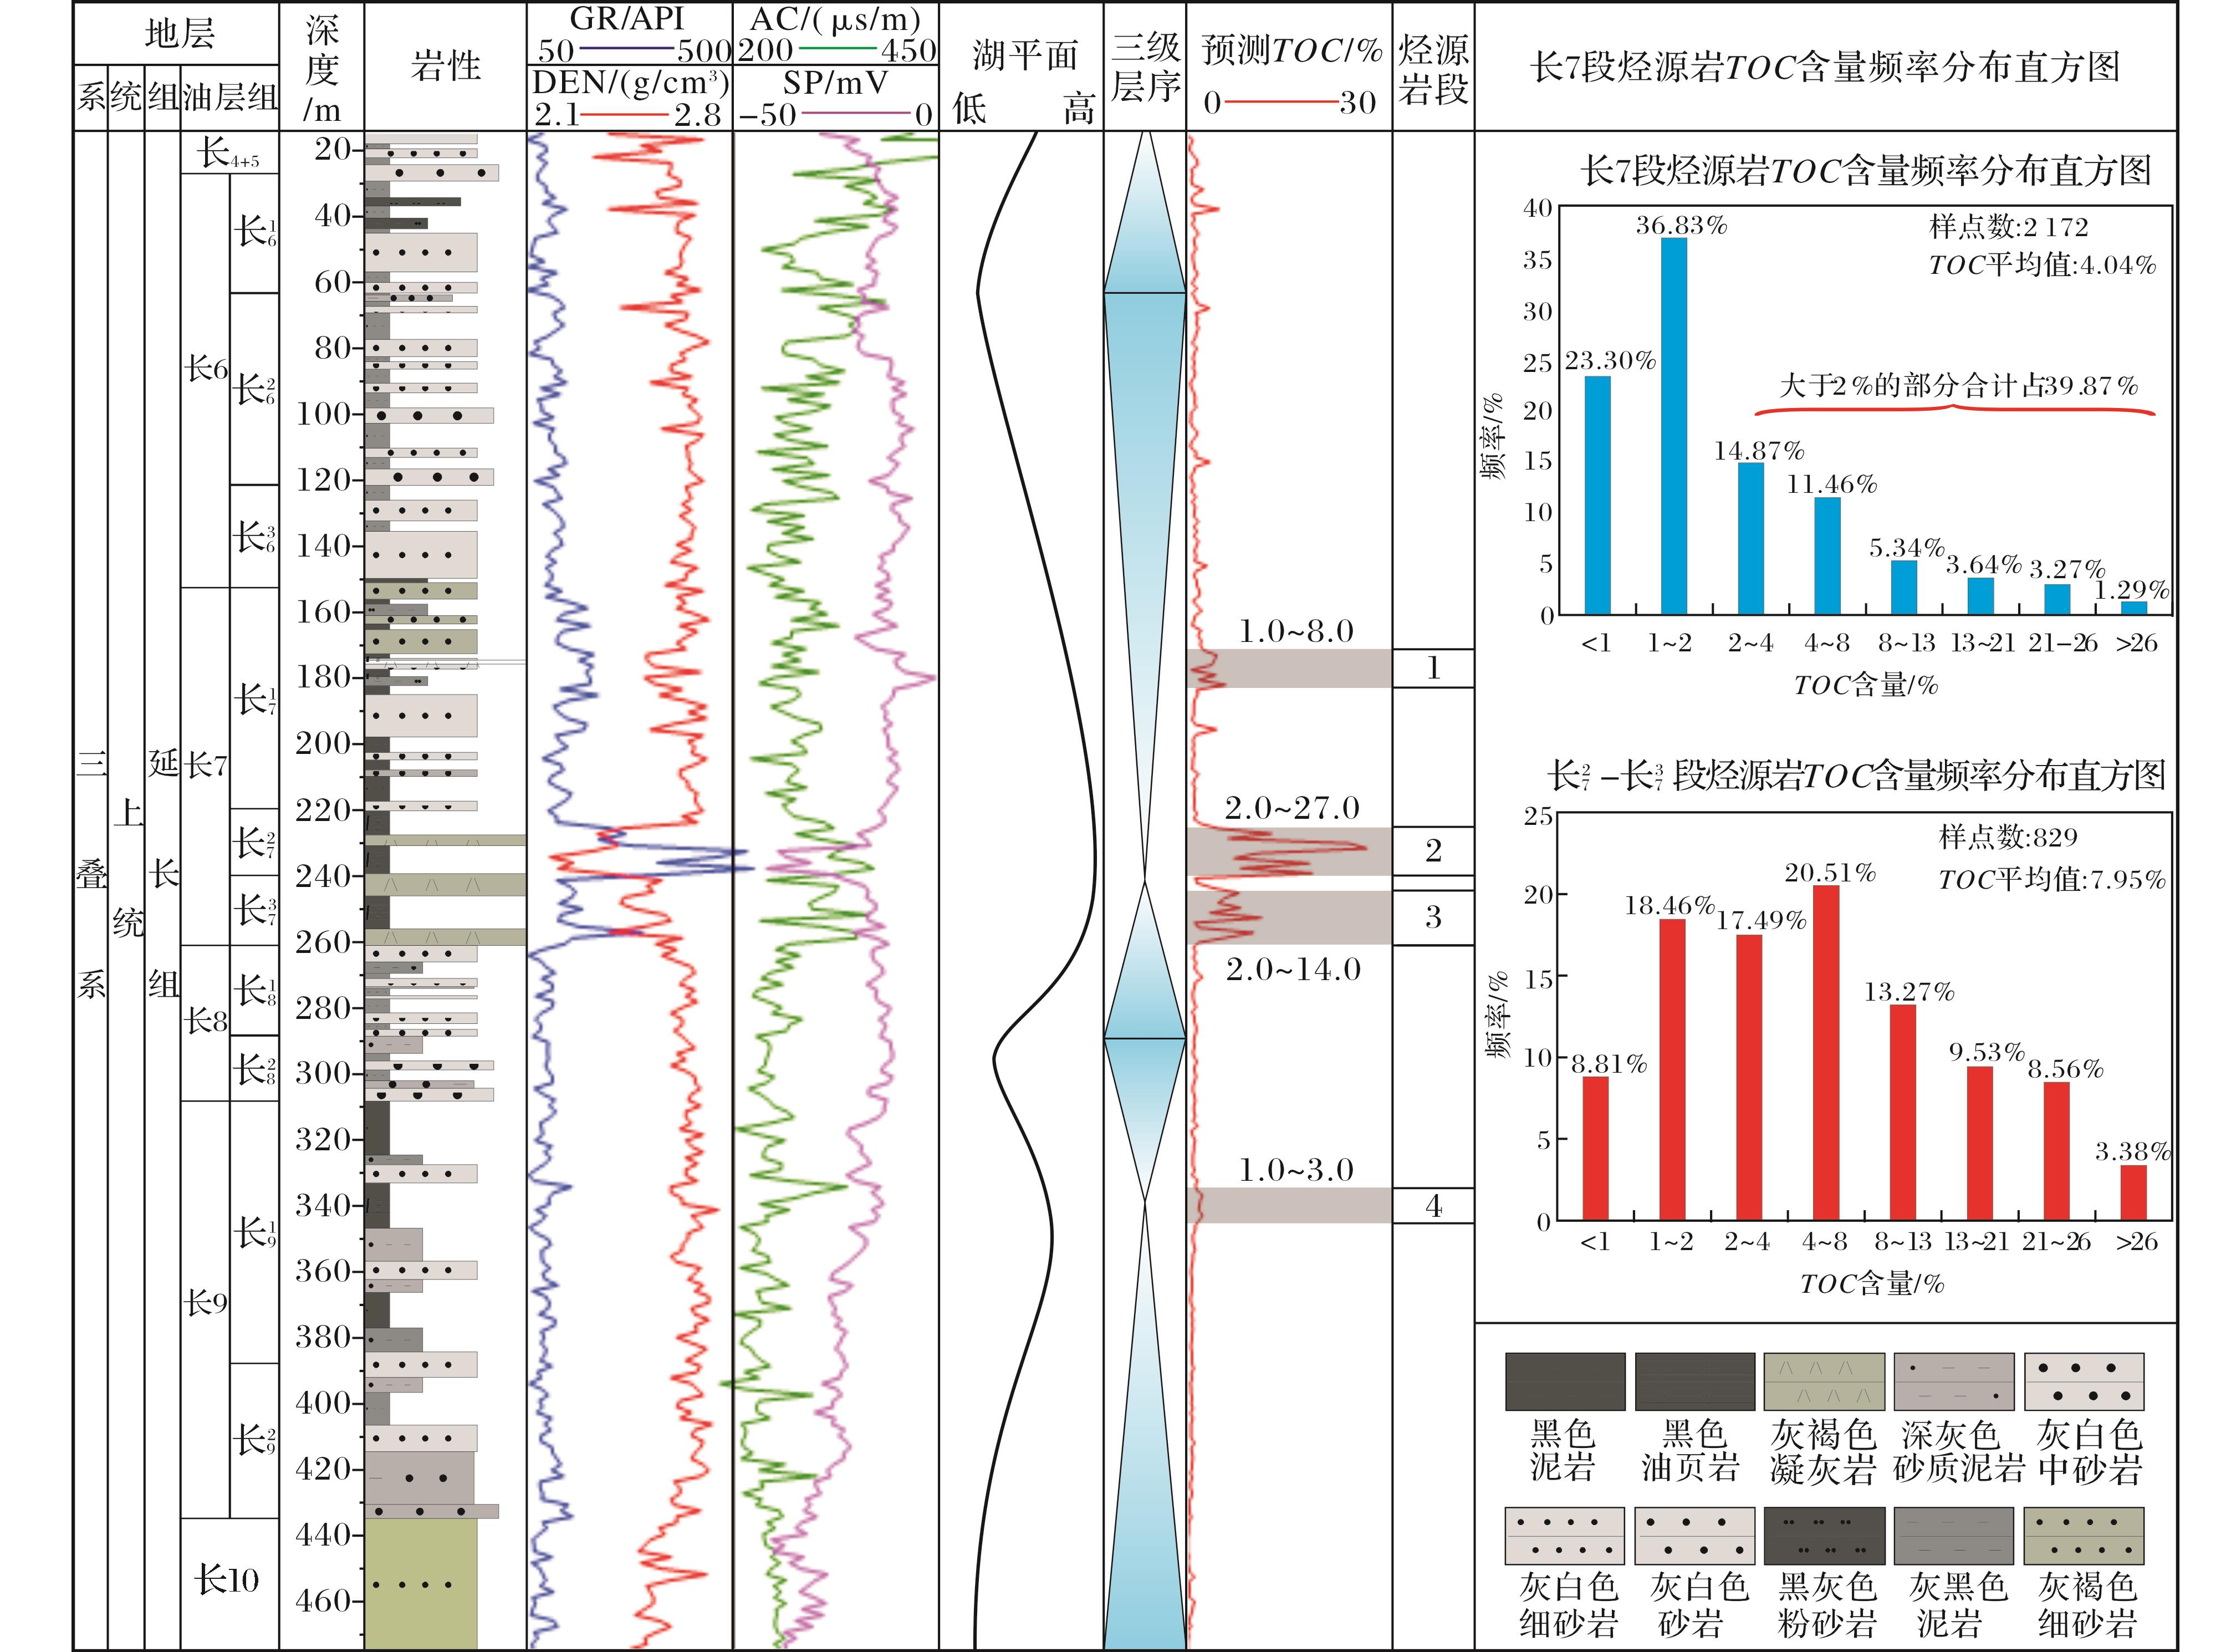
图5 BP神经网络模型预测YK1井延长组连续地层TOC含量综合图
Fig.5 Complex histogram of successive TOC value of Well YK1 predicted by BP neural network model
Table 4 Evaluation index of organic matter abundance for hydrocarbon source rocks of continental facies[38]
| 指标 | 湖盆水体类型 | 非生油岩 | 生油岩类型 | |||
| 差 | 中等 | 好 | 最好 | |||
| TOC/% | 淡水—半咸水 | <0.4 | 0.4~0.6 | 0.6~1.0 | 1.0~2.0 | >2.0 |
| 咸水—超咸水 | <0.2 | 0.2~0.4 | 0.4~1.0 | 0.6~0.8 | >0.8 | |
| 氯仿沥青“A”/% | — | <0.015 | 0.015~0.050 | 0.050~0.100 | 0.100~0.200 | >0.200 |
| HC/(×10-6) | — | <100 | 100~200 | 200~500 | 500~1 000 | >1 000 |
| (S1+S2)/(mg/g) | — | — | <2 | 2~6 | 6~20 | >20 |
注:表中评价指标适用于烃源岩(生油岩)成熟度较低(RO=0.5%~0.7%)阶段的评价
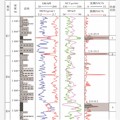
4.2 YK1井烃源岩与D48井的预测差异
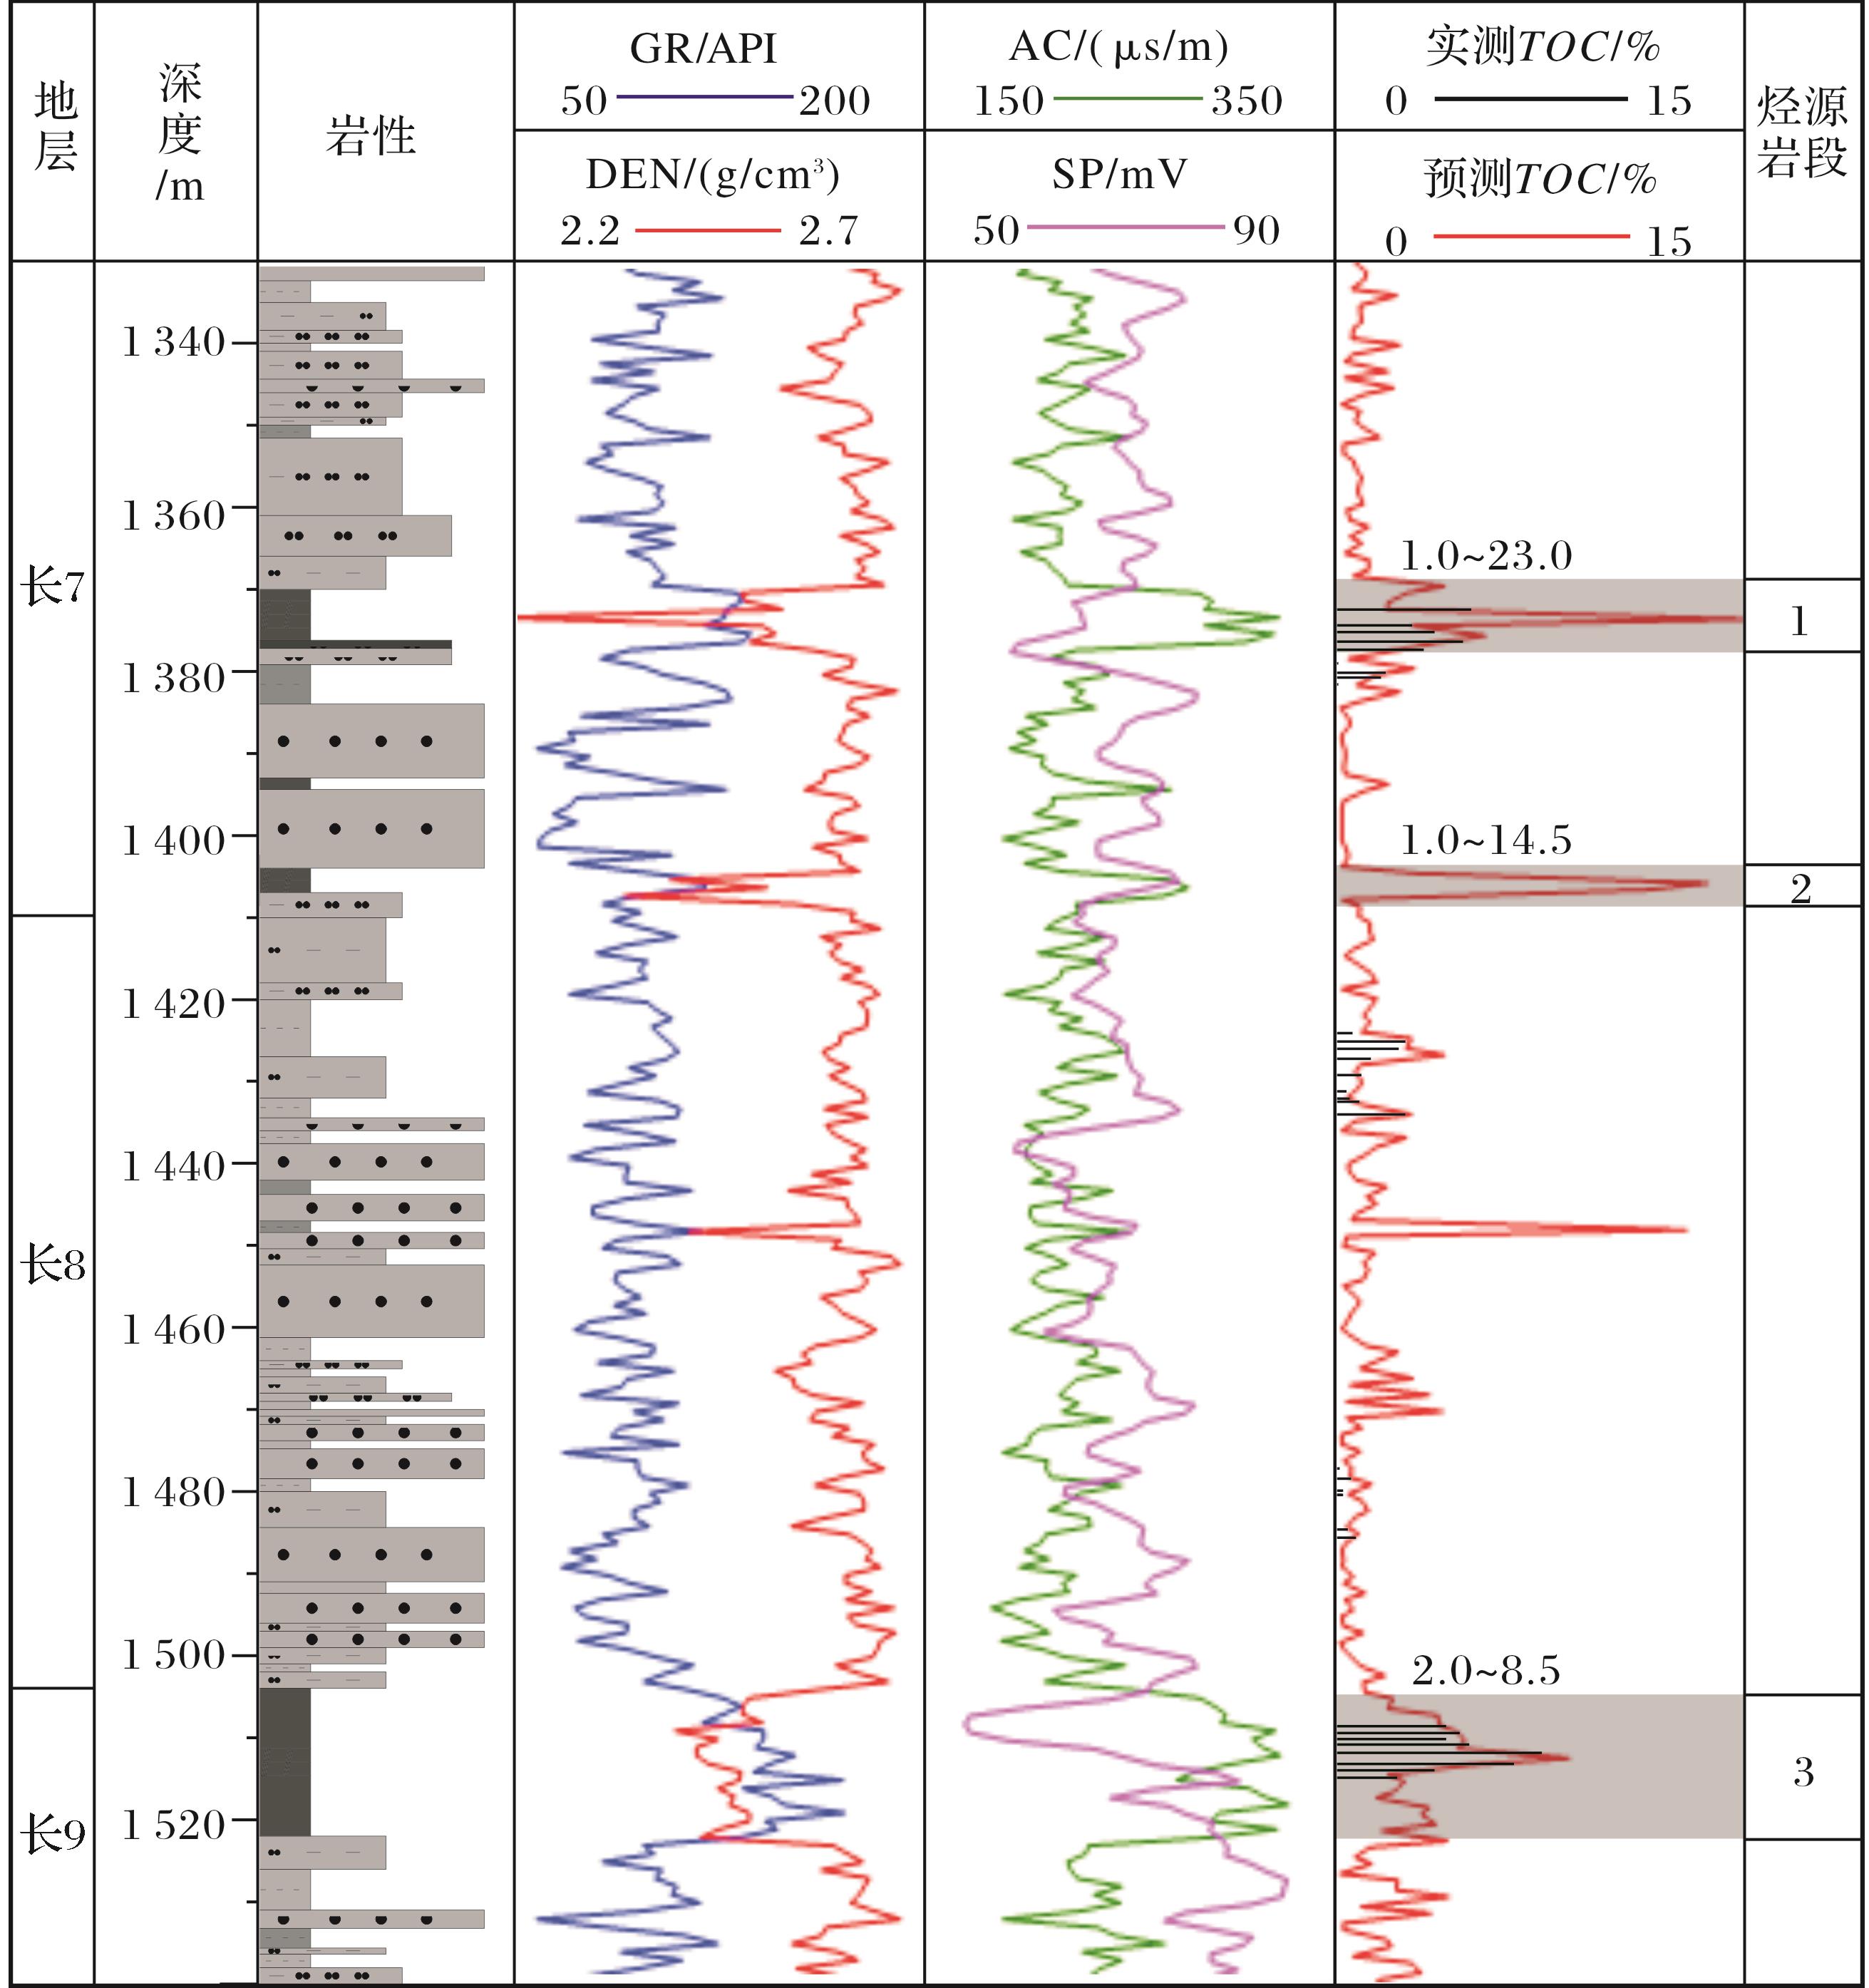
铜川地区YK1井代表了鄂尔多斯盆地现今南部近边缘区域延长组烃源岩的特征(图1,图5),将其与靠近现今盆地中央区域的D48井相同层位的烃源岩(图1,图6) 进行对比可知,D48井延长组烃
图6 D48井长7段—长9段烃源岩TOC含量综合图
Fig.6 Complex histogram of Chang7-Chang9 source rocks in Well D48
5 结论
(1)鄂尔多斯盆地延长组烃源岩TOC含量的测井预测方法中,BP神经网络模型具有最好的预测效果,计算烃源岩TOC含量的平均绝对误差小于0.2,平均相对误差小于10%,能较准确地识别连续地层中TOC含量丰富的潜在有效烃源岩。 (2)利用BP神经网络模型计算出YK1井的共9 220个TOC值,识别出鄂尔多斯盆地铜川地区延长组发育4段连续厚度大于10m的有效烃源岩,油页岩是这些有效烃源岩的重要组成;并且长27—长37段为最好的优质烃源岩,其累计厚度超过30m,TOC含量主要分布在2%~13%之间,最高达到27%。 (3)盆地不同地区延长组各层段烃源岩TOC含量预测结果与该层段岩性特征,以及沉积相的展布特征均显示出一致性,也证明了BP神经网络预测模型在延长组研究中的准确性。
参考文献(References)
[1] Wang Guiwen,Zhu Zhenyu,Zhu Guangyu.Logging identification and evaluation of Cambrian-Ordovician source rocks in syneclise of Tarim Basin[J].Petroleum Exploration and Development,2002,29(4):50-52.[王贵文,朱振宇,朱广宇.烃源岩测井识别与评价方法研究[J].石油勘探与开发,2002,29(4):50-52.]
[2] Bakhtiar H A,Telmadarreie A,Shayesteh M,et al.Estimating total organic carbon content and source rock evaluation,applying delta logr and neural network methods:Ahwaz and Marun Oilfields,Sw of Iran[J].Petroleum Science and Technology,2011,29(16):1691-1704.
[3] Huang Renchun,Wang Yan,Cheng Sijie,et al.Optimal selection of logging-based
[4] Herron S,Letendre L,Dufour M.Source rock evaluation using geochemical information from wireline logs and cores[J].AAPG Bulletin,1988,72(8):1007-1007.
[5] Serra O.Fundamentals of Well-log Interpretation:The Acquisition of Logging Data[M].New York:Elsevier,1984:1-423.
[6] Luffel D L,Guidry F K,Curtis J B.Evaluation of Devonian shale with new core and log analysis-methods[J].Journal of Petroleum Technology,1992,44(11):1192-1197.
[7] Passey Q R,Creaney S,Kulla J B,et al.A practical model for organic richness from porosity and resistivity logs[J].AAPG Bulletin,1990,74(12):1777-1794.
[8] Li Yanjun,Zhang Liehui,Feng Yuanyuan,et al.Logging evaluation method and tis application for measuring the total organic carbon content in shale gas[J].Natural Gas Geoscience,2013,24(1):169-175.[李延钧,张烈辉,冯媛媛,等.页岩有机碳含量测井评价方法及其应用[J].天然气地球科学,2013,24(1):169-175.]
[9] Mendelzon J,Toksoz M N.Source rock characterization using multivariate analysis of log data[C]//SPWLA 26th Annual Logging Symposium.Society of Petrophysicists and Well Log Analysts,1985:1-21.
[10] Schmoker J W.Determination of organic-matter content of Appalachian Devonian Shales from gamma-ray logs[J].AAPG Bulletin,1981,65(7):1285-1298.
[11] Yang Taotao,Fan Guozhang,Lü Fuliang,et al.The logging features and identification methods of source rock[J].Natural Gas Geoscience,2013,24(2):414-422.[杨涛涛,范国章,吕福亮,等.烃源岩测井响应特征及识别评价方法[J].天然气地球科学,2013,24(2):414-422.]
[12] Decker A,Hill D,Wicks D.Log-based gas content and resource estimates for the Antrim Shale,Michigan Basin[C]//Low Permeability Reservoirs Symposium.Tulsa:Society of Petroleum Engineers,1993:659-669.
[13] Schmoker J W,Hester T C.Organic-carbon in Bakken Formation,United-states portion of Williston Basin[J].AAPG Bulletin,1983,67(12):2165-2174.
[14] Fertl W H,Chilingar G V.Total organic carbon content determined from well logs[J].SPE Formation Evaluation,1988,3(2):407-419.
[15] Zhu Guangyou,Jin Qiang.Using well logging information to evaluate geochemistry characteristic of source rocks[J].Earth Science Frontiers,2003,10(2):494.[朱光有,金强.利用测井信息评价烃源岩的地球化学特征[J].地学前缘,2003,10(2):494.]
[16] Xu Sihuang,ZhuYiqing.Well logs response and prediction model of organic carbon content in source rocks:A case study from the source rock of Wenchang Formation in the Pearl Mouth Basin[J].Petroleum Geology & Experiment,2010,32(3):290-295,300.[徐思煌,朱义清.烃源岩有机碳含量的测井响应特征与定量预测模型——以珠江口盆地文昌组烃源岩为例[J].石油实验地质,2010,32(3):290-295,300.]
[17] Kamali M R,Mirshady A A.Total organic carbon content determined from well logs using delta logr and neuro fuzzy techniques[J].Journal of Petroleum Science and Engineering,2004,45(3):141-148.
[18] Yang Shaochun,Wang Na,Li Mingrui,et al.The logging evaluation of source rocks of Triassic Yanchang Formation in Chongxin area,Ordos Basin[J].Natural Gas Geoscience,2013,24(3):470-476.[杨少春,王娜,李明瑞,等.鄂尔多斯盆地崇信地区三叠系延长组烃源岩测井评价[J].天然气地球科学,2013,24(3):470-476.]
[19] Meng Zhaoping,Guo Yansheng,Liu Wei.Relationship between organic carbon content of shale gas reservoir and logging parameters and its prediction model[J].Journal of China Coal Society,2015,40(2):247-253.[孟召平,郭彦省,刘尉.页岩气储层有机碳含量与测井参数的关系及预测模型[J].煤炭学报,2015,40(2):247-253.]
[20] Huang Z,Williamson M A.Artificial neural network modelling as an aid to source rock characterization[J].Marine and Petroleum Geology,1996,13(2):277-290.
[21] Sfidari E,Kadkhodaie-ilkhchi A,Najjari S.Comparison of intelligent and statistical clustering approaches to predicting total organic carbon using intelligent systems[J].Journal of Petroleum Science and Engineering,2012,86/87:190-205.
[22] Alizadeh B,Najjari S,Kadkhodaie-ilkhchi A.Artificial neural network modeling and cluster analysis for organic facies and burial history estimation using well log data:A case study of the South Pars Gas Field,Persian Gulf,Iran[J].Computers & Geosciences,2012,45:261-269.
[23] Yang Y T,Li W,Ma L.Tectonic and stratigraphic controls of hydrocarbon systems in the Ordos Basin:A multicycle cratonic basin in central China[J].AAPG Bulletin,2005,89(2):255-269.
[24] Yang Junjie.Tectonic Evolution and Oil-gas Reservoirs Distribution in Ordos Basin[M].Beijing:Petroleum Industry Press,2002:1-228.[杨俊杰.鄂尔多斯盆地构造演化与油气分布规律[M].北京:石油工业出版社,2002:1-228.]
[25] Ji Limin.The Oil-source Correlation,Biological Source and Paleo-climate Studies of Triassic Source Rocks in Xifeng Area of East Gansu Province[D].Wuhan:China University of Geosciences,2005.[吉利民.陇东西峰地区三叠系油源、成烃母质及其发育的古环境研究[D].武汉:中国地质大学,2005.]
[26] Yanghua,Deng Xiuqin.Deposition of Yanchang Formation deep-water sandstone under the control of tectonic events,Ordos Basin[J].Petroleum Exploration and Development,2013,40(5):53-520.[杨华,邓秀芹.构造事件对鄂尔多斯盆地延长组深水砂岩沉积的影响[J].石油勘探与开发,2013,40(5):513-520.]
[27] Zhao Wenzhi,Hu Suyun,Wang Zecheng,et al.Key role of basement fault control on oil accumulation of Yanchang Formation,Upper Triassic,Ordos Basin[J].Petroleum Exploration and Development,2003,30(5):1-5.[赵文智,胡素云,汪泽成,等.鄂尔多斯盆地基底断裂在上三叠统延长组石油聚集中的控制作用[J].石油勘探与开发,2003,30(5):1-5.]
[28] Yang Hua,Fu Qiang,Fu Jinhua.Sedimentary Sequence and Petroleum Reservoirs of Ordos Basin in Trassic[M].Beijing:Geology Press,2007:1-165.[杨华,傅强,付金华.鄂尔多斯晚三叠世盆地沉积层序与油气成藏[M].北京:地质出版社,2007:1-165.]
[29] Wang Shejiao,Li Denghua,Li Jianzhong,et al.Exploration potential of shale gas in the Ordos Basin[J].Natural Gas Industry,2011,31(12):40-46,125.[王社教,李登华,李建忠,等.鄂尔多斯盆地页岩气勘探潜力分析[J].天然气工业,2011,31(12):40-46,125.]
[30] Ji Liming,Li Lintao,Wu Tao.Thermal evolution of source rocks in Yanchang Formation,Xifeng area,east Gansu Province[J].Journal of Southwest Petroleum University,2007,29(3):28-31,15.[吉利明,李林涛,吴涛.陇东西峰地区延长组烃源岩热演化程度研究[J].西南石油大学学报,2007,29(3):28-31,15,.]
[31] Ma Suping,Qi Yaling,Zhang Xiaobao,et al.Geochemical characteristics and hydrocarbon generation potential of the source rocks in Yanchang Formation,Xifeng Oilfield,Ordos Basin,NW China[J].Petroleum Exploration and Development,2005,32(3):51-54.[马素萍,漆亚玲,张晓宝,等.西峰油田延长组烃源岩生烃潜力评价[J].石油勘探与开发,2005,32(3):51-54.]
[32] Swanson V E.Oil Yield and Uranium Content of Black Shales[R].Washington D C:United States Geological Survey,1960.
[33] Lüning S,Fello N.Silurian ‘hot Shales’ in the Murzuq and Al Kufrah Basins (S.Libya):Improved predictability of source rock distribution based on gamma-ray spectrometry in surface exposures[C]//Salem M J,Oun K M,Essed A S.Sedimentary Basins of Libya,Third Symposium,the Geology of East Libya.Malta:Gutenberg Press,2008:3-12.
[34] Meinhold G,Howard J P,Strogen D,et al.Hydrocarbon source rock potential and elemental composition of Lower Silurian subsurface shales of the Eastern Murzuq Basin,Southern Libya[J].Marine and Petroleum Geology,2013,48:224-246.
[35] Stocks A,Lawrence S.Identification of source rocks from wireline logs[C]//Hurst A,Lovell M A,MortonA C.Geological Applications of Wireline Logs.London:Geological Society,1990:241-252.
[36] Qiu X W,Liu C Y,Mao G Z,et al.Major,Trace and platinum-group element geochemistry of the upper Triassic nonmarine hot shales in the Ordos Basin,Central China[J].Applied Geochemistry,2015,53:42-52.
[37] Schmoker J W.Determination of organic content of Appalachian Devonian shales from formation-density logs[J].AAPG Bulletin,1979,63(9):1504-1509.
[38] China National Petroleum Company.SY/T 5735-1995Geochemical Analysis for Hydrocarbon Source Rocks of Continenal Facies[S].Beijing:China Standard Press,1995.[中国石油天然气总公司.SY/T 5735-1995陆相烃源岩地球化学评价方法[S].北京:中国标准出版社,1995.]
[39] Gao Gang,Liu Guangdi,Fu Jinhua,et al.A new method for determining the lower limits of the organic matter abundance parameters of effective source rock:Taking the Triassic dark mudstones of Yanchang Formation in Longdong region,Ordos Basin as an example[J].Journal of Xi'an University:Natural Science Edition,2012,27(2):22-26,118.[高岗,柳广弟,付金华,等.确定有效烃源岩有机质丰度下限的一种新方法——以鄂尔多斯盆地陇东地区上三叠统延长组湖相泥质烃源岩为例[J].西安石油大学学报:自然科学版,2012,27(2):22-26,118.]
[40] Zou C N,Zhang X Y,Luo P,et al.Shallow-lacustrine sand-rich deltaic depositional cycles and sequence stratigraphy of the Upper Triassic Yanchang Formation,Ordos Basin,China[J].Basin Research,2010,22(1):108-125.
[41] Yu Jian,Yang Yajuan,Du Jinliang.Sedimentation during the transgression period in Late Triassic Yanchang Formation,Ordos Basin[J].Petroleum Exploration and Development,2010,37(2):181-187.[喻建,杨亚娟,杜金良.鄂尔多斯盆地晚三叠世延长组湖侵期沉积特征[J].石油勘探与开发,2010,37(2):181-187.]
[42] Er Chuang,Zhao Jingzhou,Wang Rui,et al.Controlling role of sedimentary environment on the distribution of organic-rich shale:A case study of the Chang 7 member of the Triassic Yanchang Formation,Ordos Basin[J].Natural Gas Geoscience,2015,26(5):823-832,892.[耳闯,赵靖舟,王芮,等.沉积环境对富有机质页岩分布的控制作用——以鄂尔多斯盆地三叠系延长组长7油层组为例[J].天然气地球科学,2015,26(5):823-832,892.]